Navajo vs Immigrants from Netherlands Bachelor's Degree
COMPARE
Navajo
Immigrants from Netherlands
Bachelor's Degree
Bachelor's Degree Comparison
Navajo
Immigrants from Netherlands
23.6%
BACHELOR'S DEGREE
0.0/ 100
METRIC RATING
344th/ 347
METRIC RANK
43.3%
BACHELOR'S DEGREE
99.7/ 100
METRIC RATING
66th/ 347
METRIC RANK
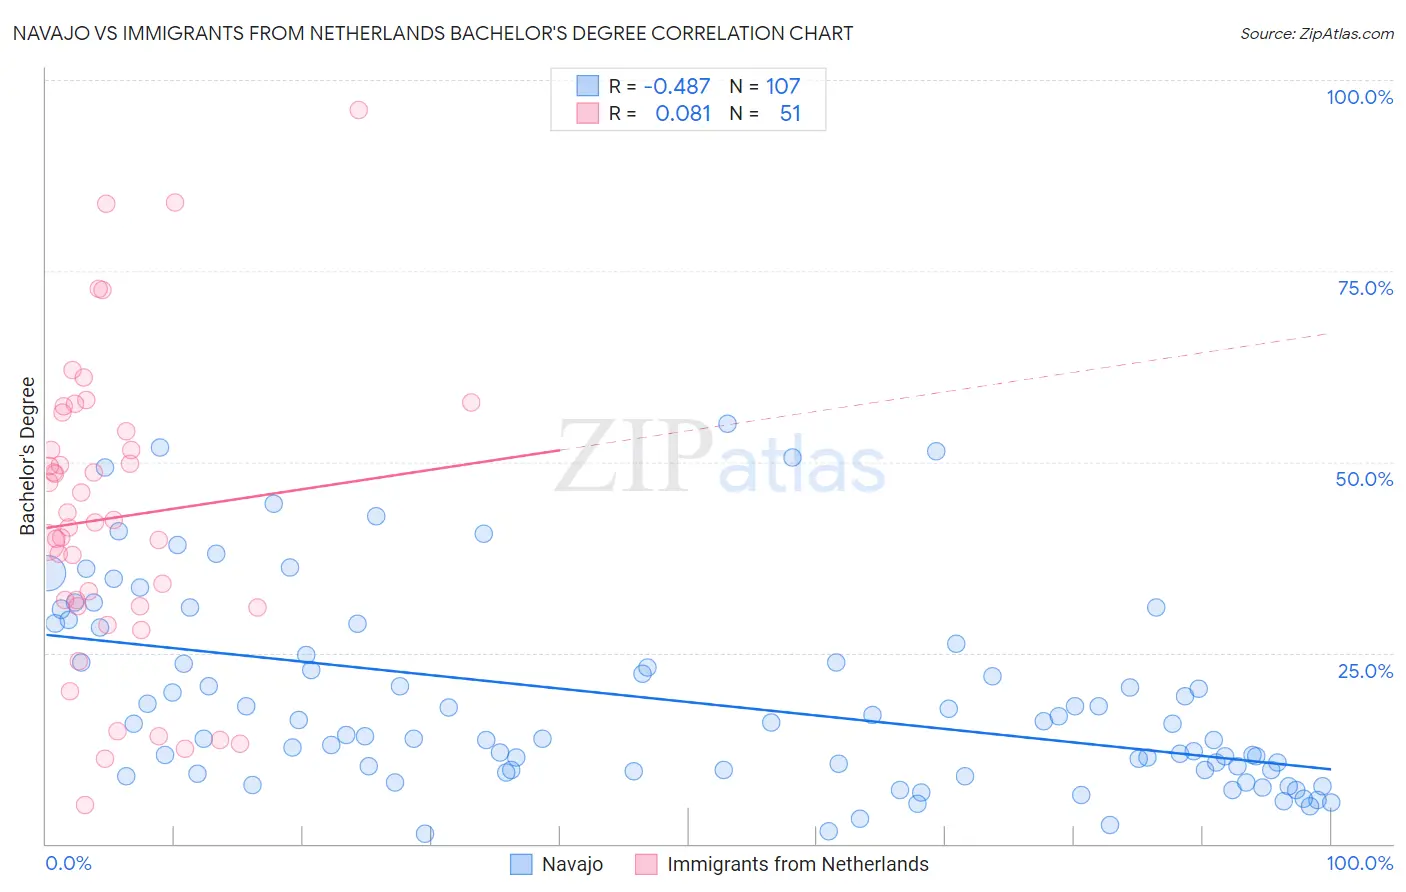
Navajo vs Immigrants from Netherlands Bachelor's Degree Correlation Chart
The statistical analysis conducted on geographies consisting of 224,864,569 people shows a moderate negative correlation between the proportion of Navajo and percentage of population with at least bachelor's degree education in the United States with a correlation coefficient (R) of -0.487 and weighted average of 23.6%. Similarly, the statistical analysis conducted on geographies consisting of 237,874,454 people shows a slight positive correlation between the proportion of Immigrants from Netherlands and percentage of population with at least bachelor's degree education in the United States with a correlation coefficient (R) of 0.081 and weighted average of 43.3%, a difference of 83.3%.
Bachelor's Degree Correlation Summary
| Measurement | Navajo | Immigrants from Netherlands |
| Minimum | 1.3% | 5.0% |
| Maximum | 54.9% | 96.1% |
| Range | 53.6% | 91.1% |
| Mean | 18.7% | 42.7% |
| Median | 14.3% | 42.1% |
| Interquartile 25% (IQ1) | 9.6% | 31.0% |
| Interquartile 75% (IQ3) | 24.7% | 54.0% |
| Interquartile Range (IQR) | 15.1% | 23.0% |
| Standard Deviation (Sample) | 12.6% | 19.6% |
| Standard Deviation (Population) | 12.5% | 19.4% |
Similar Demographics by Bachelor's Degree
Demographics Similar to Navajo by Bachelor's Degree
In terms of bachelor's degree, the demographic groups most similar to Navajo are Pima (23.2%, a difference of 1.8%), Tohono O'odham (24.4%, a difference of 3.4%), Yakama (24.5%, a difference of 3.6%), Yuman (24.5%, a difference of 3.9%), and Lumbee (24.8%, a difference of 4.8%).
| Demographics | Rating | Rank | Bachelor's Degree |
| Mexicans | 0.0 /100 | #333 | Tragic 27.1% |
| Arapaho | 0.0 /100 | #334 | Tragic 26.6% |
| Natives/Alaskans | 0.0 /100 | #335 | Tragic 26.3% |
| Immigrants | Mexico | 0.0 /100 | #336 | Tragic 26.1% |
| Inupiat | 0.0 /100 | #337 | Tragic 25.8% |
| Pueblo | 0.0 /100 | #338 | Tragic 25.5% |
| Hopi | 0.0 /100 | #339 | Tragic 25.3% |
| Lumbee | 0.0 /100 | #340 | Tragic 24.8% |
| Yuman | 0.0 /100 | #341 | Tragic 24.5% |
| Yakama | 0.0 /100 | #342 | Tragic 24.5% |
| Tohono O'odham | 0.0 /100 | #343 | Tragic 24.4% |
| Navajo | 0.0 /100 | #344 | Tragic 23.6% |
| Pima | 0.0 /100 | #345 | Tragic 23.2% |
| Houma | 0.0 /100 | #346 | Tragic 21.4% |
| Yup'ik | 0.0 /100 | #347 | Tragic 19.4% |
Demographics Similar to Immigrants from Netherlands by Bachelor's Degree
In terms of bachelor's degree, the demographic groups most similar to Immigrants from Netherlands are Argentinean (43.3%, a difference of 0.020%), Zimbabwean (43.3%, a difference of 0.020%), Egyptian (43.3%, a difference of 0.020%), Immigrants from Indonesia (43.3%, a difference of 0.040%), and Immigrants from Europe (43.4%, a difference of 0.30%).
| Demographics | Rating | Rank | Bachelor's Degree |
| Australians | 99.9 /100 | #59 | Exceptional 44.0% |
| New Zealanders | 99.9 /100 | #60 | Exceptional 44.0% |
| South Africans | 99.8 /100 | #61 | Exceptional 43.6% |
| Immigrants | Kazakhstan | 99.8 /100 | #62 | Exceptional 43.4% |
| Immigrants | Europe | 99.8 /100 | #63 | Exceptional 43.4% |
| Argentineans | 99.7 /100 | #64 | Exceptional 43.3% |
| Zimbabweans | 99.7 /100 | #65 | Exceptional 43.3% |
| Immigrants | Netherlands | 99.7 /100 | #66 | Exceptional 43.3% |
| Egyptians | 99.7 /100 | #67 | Exceptional 43.3% |
| Immigrants | Indonesia | 99.7 /100 | #68 | Exceptional 43.3% |
| Immigrants | Pakistan | 99.7 /100 | #69 | Exceptional 43.1% |
| Immigrants | Romania | 99.6 /100 | #70 | Exceptional 42.9% |
| Immigrants | Argentina | 99.6 /100 | #71 | Exceptional 42.8% |
| Ethiopians | 99.5 /100 | #72 | Exceptional 42.8% |
| Immigrants | Uzbekistan | 99.5 /100 | #73 | Exceptional 42.8% |