Central American Indian vs Tohono O'odham Unemployment Among Women with Children Under 18 years
COMPARE
Central American Indian
Tohono O'odham
Unemployment Among Women with Children Under 18 years
Unemployment Among Women with Children Under 18 years Comparison
Central American Indians
Tohono O'odham
6.7%
UNEMPLOYMENT AMONG WOMEN WITH CHILDREN UNDER 18 YEARS
0.0/ 100
METRIC RATING
319th/ 347
METRIC RANK
8.9%
UNEMPLOYMENT AMONG WOMEN WITH CHILDREN UNDER 18 YEARS
0.0/ 100
METRIC RATING
341st/ 347
METRIC RANK
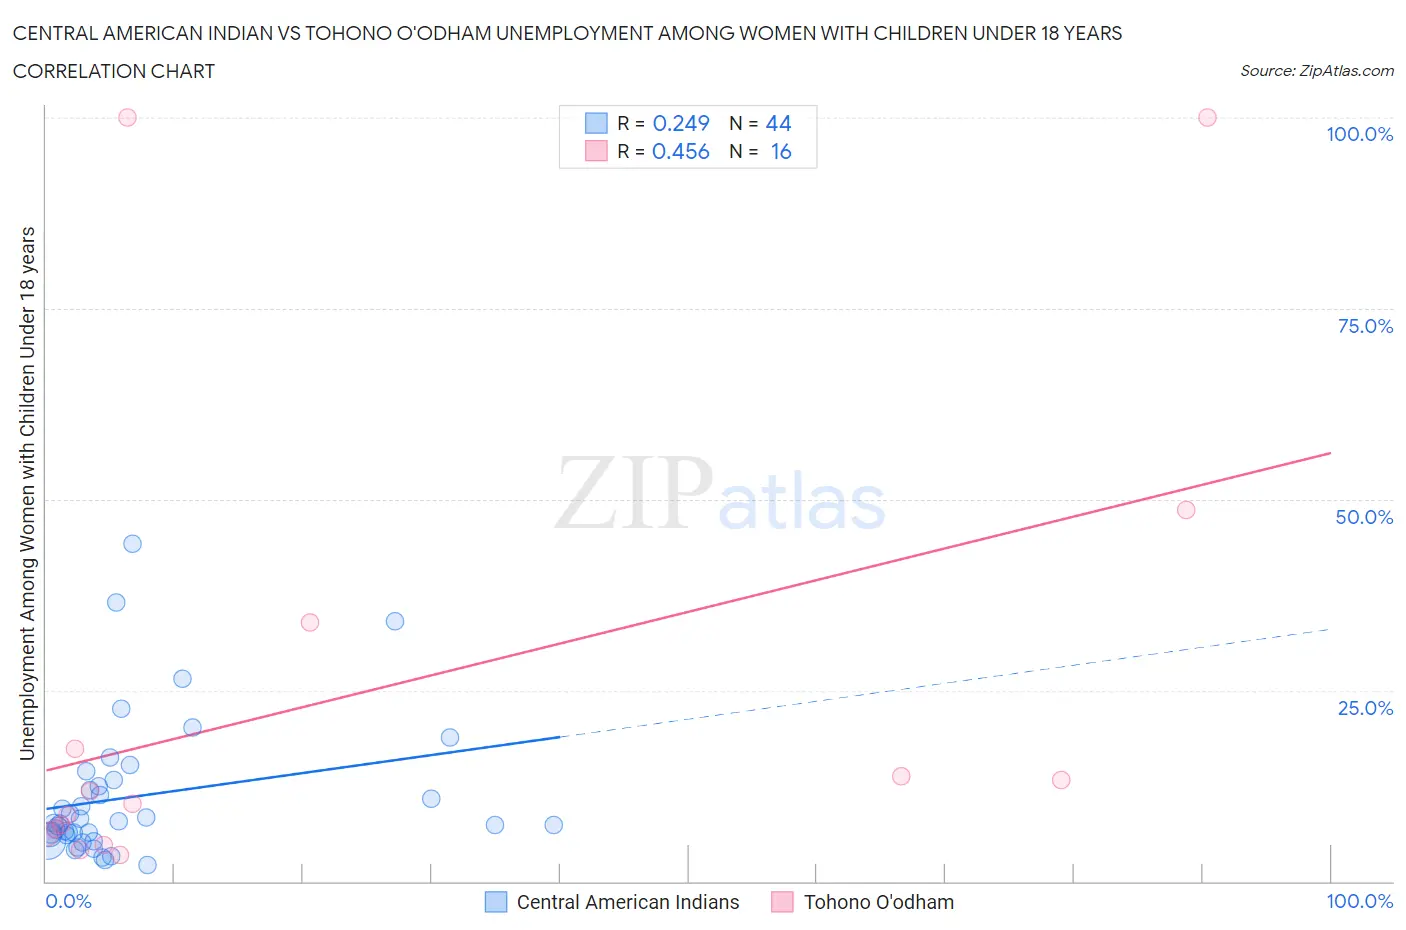
Central American Indian vs Tohono O'odham Unemployment Among Women with Children Under 18 years Correlation Chart
The statistical analysis conducted on geographies consisting of 319,090,954 people shows a weak positive correlation between the proportion of Central American Indians and unemployment rate among women with children under the age of 18 in the United States with a correlation coefficient (R) of 0.249 and weighted average of 6.7%. Similarly, the statistical analysis conducted on geographies consisting of 58,389,482 people shows a moderate positive correlation between the proportion of Tohono O'odham and unemployment rate among women with children under the age of 18 in the United States with a correlation coefficient (R) of 0.456 and weighted average of 8.9%, a difference of 32.8%.
Unemployment Among Women with Children Under 18 years Correlation Summary
| Measurement | Central American Indian | Tohono O'odham |
| Minimum | 2.1% | 3.4% |
| Maximum | 44.2% | 100.0% |
| Range | 42.1% | 96.6% |
| Mean | 11.1% | 24.4% |
| Median | 7.6% | 10.9% |
| Interquartile 25% (IQ1) | 6.0% | 6.5% |
| Interquartile 75% (IQ3) | 12.8% | 25.6% |
| Interquartile Range (IQR) | 6.8% | 19.1% |
| Standard Deviation (Sample) | 9.2% | 31.8% |
| Standard Deviation (Population) | 9.1% | 30.8% |
Similar Demographics by Unemployment Among Women with Children Under 18 years
Demographics Similar to Central American Indians by Unemployment Among Women with Children Under 18 years
In terms of unemployment among women with children under 18 years, the demographic groups most similar to Central American Indians are Immigrants from Belize (6.7%, a difference of 0.090%), U.S. Virgin Islander (6.7%, a difference of 0.14%), Alaska Native (6.7%, a difference of 0.24%), Shoshone (6.6%, a difference of 0.53%), and Immigrants from Ecuador (6.6%, a difference of 0.57%).
| Demographics | Rating | Rank | Unemployment Among Women with Children Under 18 years |
| Immigrants | Mexico | 0.0 /100 | #312 | Tragic 6.6% |
| Hispanics or Latinos | 0.0 /100 | #313 | Tragic 6.6% |
| British West Indians | 0.0 /100 | #314 | Tragic 6.6% |
| Immigrants | West Indies | 0.0 /100 | #315 | Tragic 6.6% |
| Immigrants | Ecuador | 0.0 /100 | #316 | Tragic 6.6% |
| Shoshone | 0.0 /100 | #317 | Tragic 6.6% |
| Alaska Natives | 0.0 /100 | #318 | Tragic 6.7% |
| Central American Indians | 0.0 /100 | #319 | Tragic 6.7% |
| Immigrants | Belize | 0.0 /100 | #320 | Tragic 6.7% |
| U.S. Virgin Islanders | 0.0 /100 | #321 | Tragic 6.7% |
| Houma | 0.0 /100 | #322 | Tragic 6.8% |
| Pueblo | 0.0 /100 | #323 | Tragic 6.8% |
| Paiute | 0.0 /100 | #324 | Tragic 6.9% |
| Immigrants | Dominica | 0.0 /100 | #325 | Tragic 7.0% |
| Chippewa | 0.0 /100 | #326 | Tragic 7.0% |
Demographics Similar to Tohono O'odham by Unemployment Among Women with Children Under 18 years
In terms of unemployment among women with children under 18 years, the demographic groups most similar to Tohono O'odham are Puerto Rican (9.0%, a difference of 1.7%), Arapaho (9.2%, a difference of 3.8%), Crow (8.2%, a difference of 7.5%), Navajo (8.2%, a difference of 7.7%), and Inupiat (9.6%, a difference of 8.1%).
| Demographics | Rating | Rank | Unemployment Among Women with Children Under 18 years |
| Immigrants | Dominican Republic | 0.0 /100 | #333 | Tragic 7.5% |
| Cheyenne | 0.0 /100 | #334 | Tragic 7.8% |
| Apache | 0.0 /100 | #335 | Tragic 7.9% |
| Sioux | 0.0 /100 | #336 | Tragic 7.9% |
| Yakama | 0.0 /100 | #337 | Tragic 8.1% |
| Immigrants | Yemen | 0.0 /100 | #338 | Tragic 8.2% |
| Navajo | 0.0 /100 | #339 | Tragic 8.2% |
| Crow | 0.0 /100 | #340 | Tragic 8.2% |
| Tohono O'odham | 0.0 /100 | #341 | Tragic 8.9% |
| Puerto Ricans | 0.0 /100 | #342 | Tragic 9.0% |
| Arapaho | 0.0 /100 | #343 | Tragic 9.2% |
| Inupiat | 0.0 /100 | #344 | Tragic 9.6% |
| Yuman | 0.0 /100 | #345 | Tragic 9.8% |
| Yup'ik | 0.0 /100 | #346 | Tragic 11.0% |
| Pima | 0.0 /100 | #347 | Tragic 11.7% |