Native/Alaskan vs Jordanian Unemployment Among Ages 35 to 44 years
COMPARE
Native/Alaskan
Jordanian
Unemployment Among Ages 35 to 44 years
Unemployment Among Ages 35 to 44 years Comparison
Natives/Alaskans
Jordanians
7.3%
UNEMPLOYMENT AMONG AGES 35 TO 44 YEARS
0.0/ 100
METRIC RATING
332nd/ 347
METRIC RANK
4.3%
UNEMPLOYMENT AMONG AGES 35 TO 44 YEARS
99.0/ 100
METRIC RATING
34th/ 347
METRIC RANK
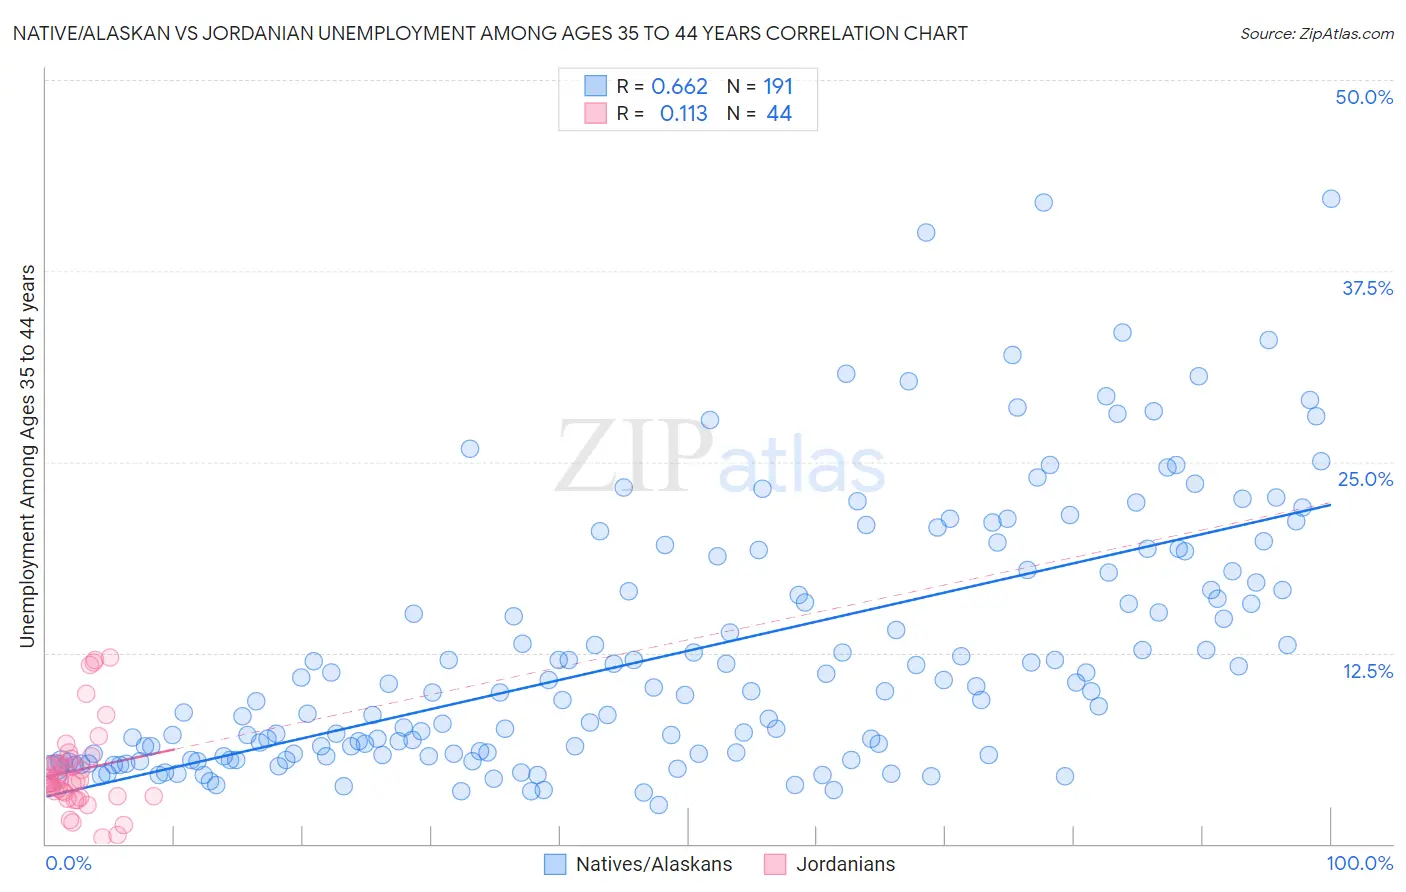
Native/Alaskan vs Jordanian Unemployment Among Ages 35 to 44 years Correlation Chart
The statistical analysis conducted on geographies consisting of 490,779,782 people shows a significant positive correlation between the proportion of Natives/Alaskans and unemployment rate among population between the ages 35 and 44 in the United States with a correlation coefficient (R) of 0.662 and weighted average of 7.3%. Similarly, the statistical analysis conducted on geographies consisting of 165,487,232 people shows a poor positive correlation between the proportion of Jordanians and unemployment rate among population between the ages 35 and 44 in the United States with a correlation coefficient (R) of 0.113 and weighted average of 4.3%, a difference of 68.4%.
Unemployment Among Ages 35 to 44 years Correlation Summary
| Measurement | Native/Alaskan | Jordanian |
| Minimum | 2.5% | 0.40% |
| Maximum | 42.2% | 12.2% |
| Range | 39.7% | 11.8% |
| Mean | 12.6% | 4.8% |
| Median | 10.0% | 4.2% |
| Interquartile 25% (IQ1) | 5.8% | 3.1% |
| Interquartile 75% (IQ3) | 17.9% | 5.4% |
| Interquartile Range (IQR) | 12.0% | 2.3% |
| Standard Deviation (Sample) | 8.5% | 2.9% |
| Standard Deviation (Population) | 8.5% | 2.9% |
Similar Demographics by Unemployment Among Ages 35 to 44 years
Demographics Similar to Natives/Alaskans by Unemployment Among Ages 35 to 44 years
In terms of unemployment among ages 35 to 44 years, the demographic groups most similar to Natives/Alaskans are Pueblo (7.1%, a difference of 2.9%), Puerto Rican (7.6%, a difference of 5.2%), Immigrants from Cabo Verde (6.9%, a difference of 5.5%), Paiute (6.9%, a difference of 5.5%), and Houma (7.8%, a difference of 8.0%).
| Demographics | Rating | Rank | Unemployment Among Ages 35 to 44 years |
| Immigrants | Yemen | 0.0 /100 | #325 | Tragic 6.6% |
| Alaska Natives | 0.0 /100 | #326 | Tragic 6.6% |
| Cape Verdeans | 0.0 /100 | #327 | Tragic 6.6% |
| Shoshone | 0.0 /100 | #328 | Tragic 6.6% |
| Paiute | 0.0 /100 | #329 | Tragic 6.9% |
| Immigrants | Cabo Verde | 0.0 /100 | #330 | Tragic 6.9% |
| Pueblo | 0.0 /100 | #331 | Tragic 7.1% |
| Natives/Alaskans | 0.0 /100 | #332 | Tragic 7.3% |
| Puerto Ricans | 0.0 /100 | #333 | Tragic 7.6% |
| Houma | 0.0 /100 | #334 | Tragic 7.8% |
| Sioux | 0.0 /100 | #335 | Tragic 8.4% |
| Apache | 0.0 /100 | #336 | Tragic 8.4% |
| Tohono O'odham | 0.0 /100 | #337 | Tragic 8.4% |
| Cheyenne | 0.0 /100 | #338 | Tragic 8.5% |
| Inupiat | 0.0 /100 | #339 | Tragic 8.6% |
Demographics Similar to Jordanians by Unemployment Among Ages 35 to 44 years
In terms of unemployment among ages 35 to 44 years, the demographic groups most similar to Jordanians are Luxembourger (4.3%, a difference of 0.030%), Mongolian (4.3%, a difference of 0.13%), Immigrants from Sri Lanka (4.3%, a difference of 0.15%), Immigrants from Zimbabwe (4.3%, a difference of 0.18%), and Burmese (4.3%, a difference of 0.25%).
| Demographics | Rating | Rank | Unemployment Among Ages 35 to 44 years |
| Assyrians/Chaldeans/Syriacs | 99.3 /100 | #27 | Exceptional 4.3% |
| Immigrants | Japan | 99.3 /100 | #28 | Exceptional 4.3% |
| Europeans | 99.2 /100 | #29 | Exceptional 4.3% |
| Immigrants | Pakistan | 99.2 /100 | #30 | Exceptional 4.3% |
| Carpatho Rusyns | 99.2 /100 | #31 | Exceptional 4.3% |
| Chinese | 99.1 /100 | #32 | Exceptional 4.3% |
| Immigrants | Sri Lanka | 99.1 /100 | #33 | Exceptional 4.3% |
| Jordanians | 99.0 /100 | #34 | Exceptional 4.3% |
| Luxembourgers | 99.0 /100 | #35 | Exceptional 4.3% |
| Mongolians | 98.9 /100 | #36 | Exceptional 4.3% |
| Immigrants | Zimbabwe | 98.9 /100 | #37 | Exceptional 4.3% |
| Burmese | 98.9 /100 | #38 | Exceptional 4.3% |
| Palestinians | 98.8 /100 | #39 | Exceptional 4.3% |
| Zimbabweans | 98.8 /100 | #40 | Exceptional 4.3% |
| Belgians | 98.7 /100 | #41 | Exceptional 4.3% |