Ottawa vs Immigrants from Guyana Unemployment Among Ages 35 to 44 years
COMPARE
Ottawa
Immigrants from Guyana
Unemployment Among Ages 35 to 44 years
Unemployment Among Ages 35 to 44 years Comparison
Ottawa
Immigrants from Guyana
5.6%
UNEMPLOYMENT AMONG AGES 35 TO 44 YEARS
0.0/ 100
METRIC RATING
295th/ 347
METRIC RANK
6.0%
UNEMPLOYMENT AMONG AGES 35 TO 44 YEARS
0.0/ 100
METRIC RATING
312th/ 347
METRIC RANK
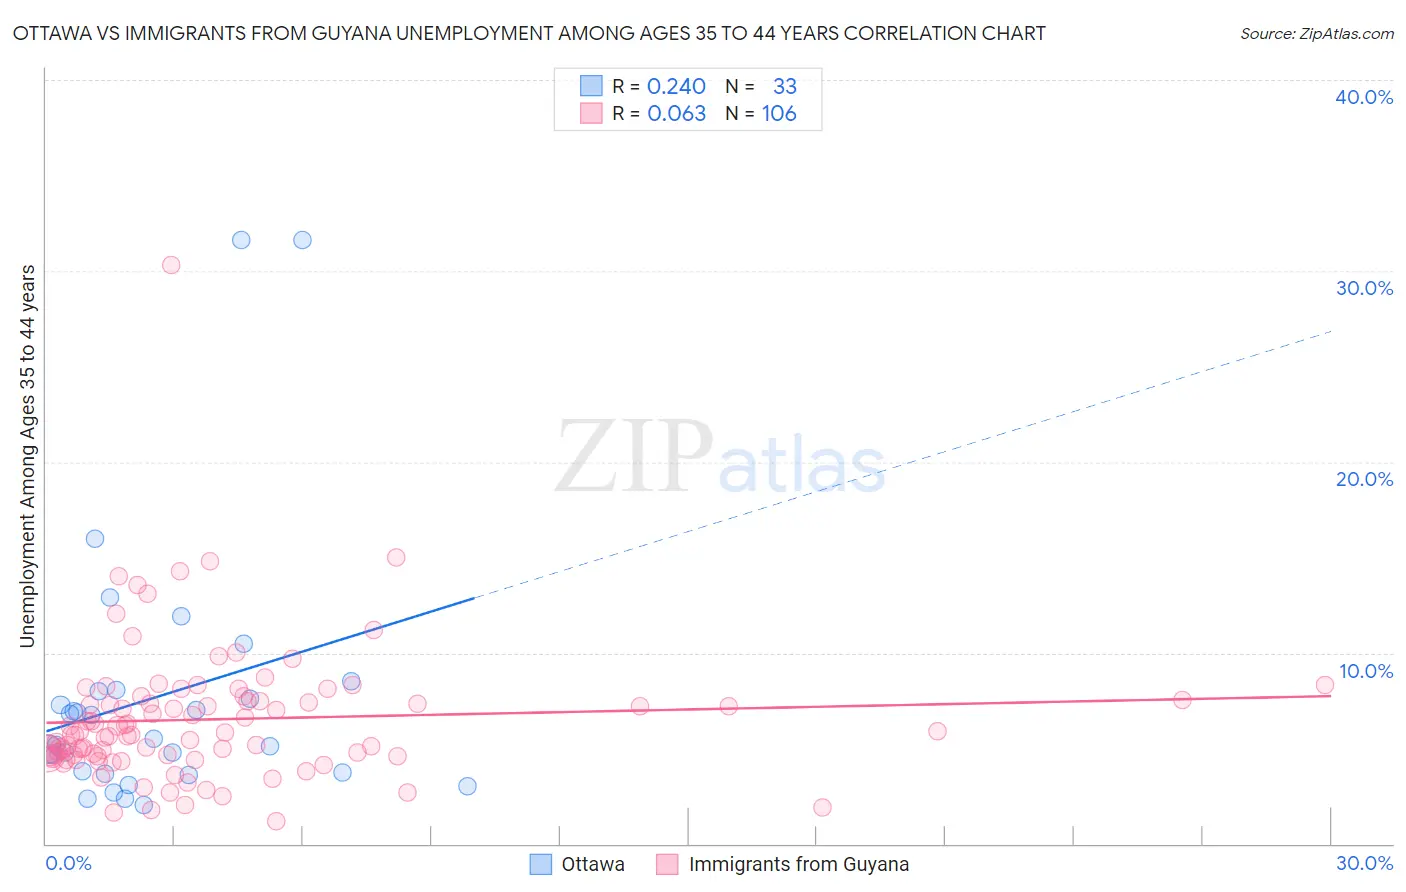
Ottawa vs Immigrants from Guyana Unemployment Among Ages 35 to 44 years Correlation Chart
The statistical analysis conducted on geographies consisting of 49,559,815 people shows a weak positive correlation between the proportion of Ottawa and unemployment rate among population between the ages 35 and 44 in the United States with a correlation coefficient (R) of 0.240 and weighted average of 5.6%. Similarly, the statistical analysis conducted on geographies consisting of 182,093,178 people shows a slight positive correlation between the proportion of Immigrants from Guyana and unemployment rate among population between the ages 35 and 44 in the United States with a correlation coefficient (R) of 0.063 and weighted average of 6.0%, a difference of 7.1%.
Unemployment Among Ages 35 to 44 years Correlation Summary
| Measurement | Ottawa | Immigrants from Guyana |
| Minimum | 2.0% | 1.2% |
| Maximum | 31.6% | 30.3% |
| Range | 29.6% | 29.1% |
| Mean | 7.7% | 6.5% |
| Median | 5.5% | 5.7% |
| Interquartile 25% (IQ1) | 3.7% | 4.6% |
| Interquartile 75% (IQ3) | 8.0% | 7.5% |
| Interquartile Range (IQR) | 4.3% | 2.9% |
| Standard Deviation (Sample) | 6.9% | 3.7% |
| Standard Deviation (Population) | 6.8% | 3.6% |
Demographics Similar to Ottawa and Immigrants from Guyana by Unemployment Among Ages 35 to 44 years
In terms of unemployment among ages 35 to 44 years, the demographic groups most similar to Ottawa are Immigrants from Trinidad and Tobago (5.6%, a difference of 0.020%), U.S. Virgin Islander (5.6%, a difference of 0.12%), Aleut (5.6%, a difference of 0.13%), Trinidadian and Tobagonian (5.6%, a difference of 0.22%), and Central American Indian (5.6%, a difference of 0.23%). Similarly, the demographic groups most similar to Immigrants from Guyana are British West Indian (6.0%, a difference of 0.12%), Marshallese (5.9%, a difference of 1.1%), Guyanese (5.9%, a difference of 1.4%), Immigrants from Barbados (5.8%, a difference of 3.1%), and Immigrants from the Azores (5.8%, a difference of 3.4%).
| Demographics | Rating | Rank | Unemployment Among Ages 35 to 44 years |
| Central American Indians | 0.0 /100 | #293 | Tragic 5.6% |
| Trinidadians and Tobagonians | 0.0 /100 | #294 | Tragic 5.6% |
| Ottawa | 0.0 /100 | #295 | Tragic 5.6% |
| Immigrants | Trinidad and Tobago | 0.0 /100 | #296 | Tragic 5.6% |
| U.S. Virgin Islanders | 0.0 /100 | #297 | Tragic 5.6% |
| Aleuts | 0.0 /100 | #298 | Tragic 5.6% |
| Immigrants | Jamaica | 0.0 /100 | #299 | Tragic 5.6% |
| Immigrants | West Indies | 0.0 /100 | #300 | Tragic 5.6% |
| Africans | 0.0 /100 | #301 | Tragic 5.6% |
| Nepalese | 0.0 /100 | #302 | Tragic 5.6% |
| Yakama | 0.0 /100 | #303 | Tragic 5.6% |
| West Indians | 0.0 /100 | #304 | Tragic 5.7% |
| Belizeans | 0.0 /100 | #305 | Tragic 5.7% |
| Barbadians | 0.0 /100 | #306 | Tragic 5.7% |
| Immigrants | Belize | 0.0 /100 | #307 | Tragic 5.8% |
| Immigrants | Azores | 0.0 /100 | #308 | Tragic 5.8% |
| Immigrants | Barbados | 0.0 /100 | #309 | Tragic 5.8% |
| Guyanese | 0.0 /100 | #310 | Tragic 5.9% |
| Marshallese | 0.0 /100 | #311 | Tragic 5.9% |
| Immigrants | Guyana | 0.0 /100 | #312 | Tragic 6.0% |
| British West Indians | 0.0 /100 | #313 | Tragic 6.0% |