Seminole vs Immigrants from Guyana Unemployment Among Ages 35 to 44 years
COMPARE
Seminole
Immigrants from Guyana
Unemployment Among Ages 35 to 44 years
Unemployment Among Ages 35 to 44 years Comparison
Seminole
Immigrants from Guyana
5.2%
UNEMPLOYMENT AMONG AGES 35 TO 44 YEARS
0.1/ 100
METRIC RATING
256th/ 347
METRIC RANK
6.0%
UNEMPLOYMENT AMONG AGES 35 TO 44 YEARS
0.0/ 100
METRIC RATING
312th/ 347
METRIC RANK
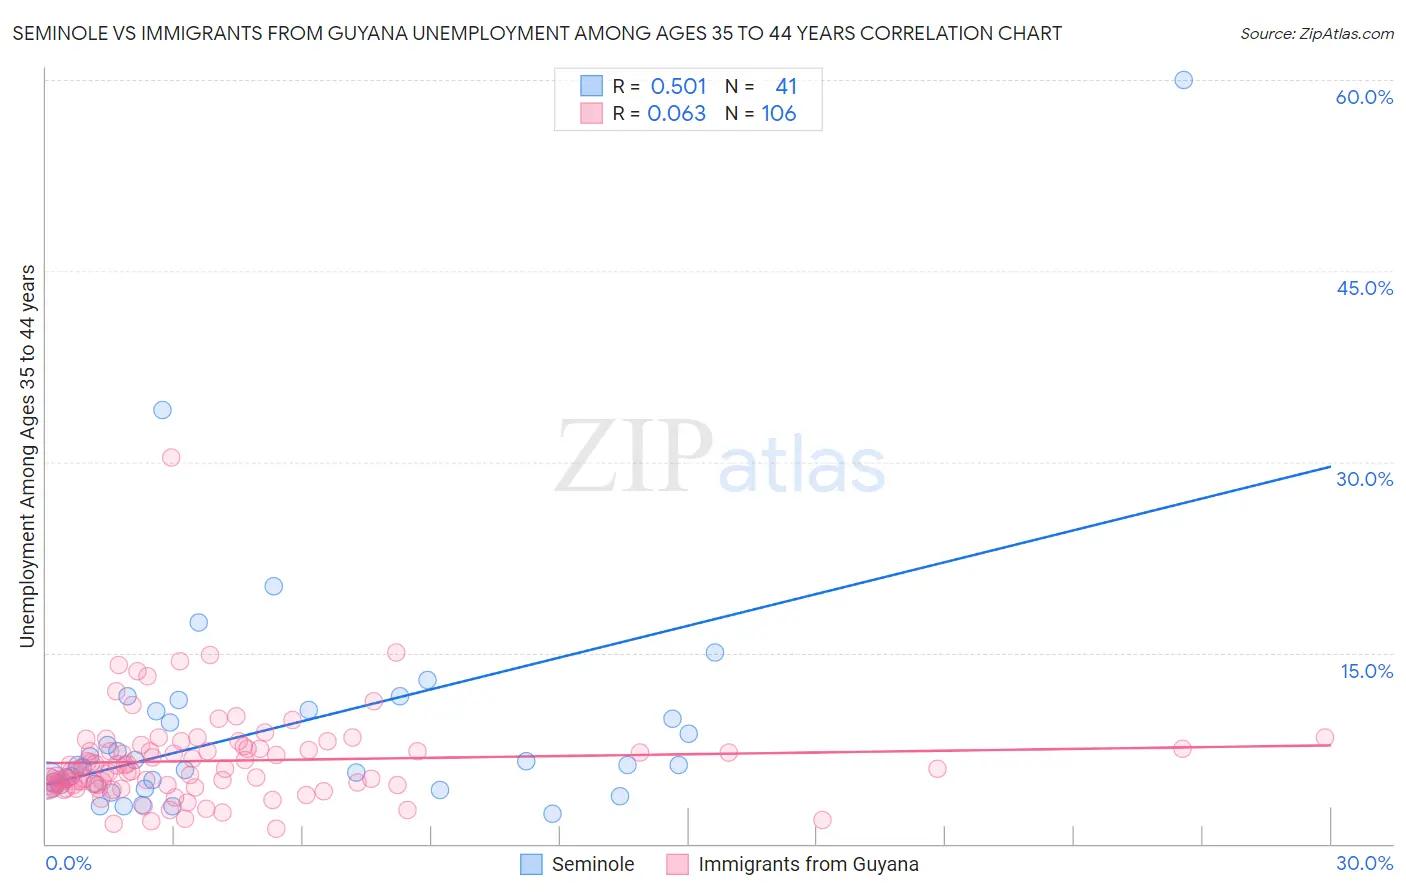
Seminole vs Immigrants from Guyana Unemployment Among Ages 35 to 44 years Correlation Chart
The statistical analysis conducted on geographies consisting of 117,376,449 people shows a substantial positive correlation between the proportion of Seminole and unemployment rate among population between the ages 35 and 44 in the United States with a correlation coefficient (R) of 0.501 and weighted average of 5.2%. Similarly, the statistical analysis conducted on geographies consisting of 182,093,178 people shows a slight positive correlation between the proportion of Immigrants from Guyana and unemployment rate among population between the ages 35 and 44 in the United States with a correlation coefficient (R) of 0.063 and weighted average of 6.0%, a difference of 13.9%.
Unemployment Among Ages 35 to 44 years Correlation Summary
| Measurement | Seminole | Immigrants from Guyana |
| Minimum | 2.4% | 1.2% |
| Maximum | 60.0% | 30.3% |
| Range | 57.6% | 29.1% |
| Mean | 9.2% | 6.5% |
| Median | 6.2% | 5.7% |
| Interquartile 25% (IQ1) | 4.7% | 4.6% |
| Interquartile 75% (IQ3) | 10.5% | 7.5% |
| Interquartile Range (IQR) | 5.8% | 2.9% |
| Standard Deviation (Sample) | 10.0% | 3.7% |
| Standard Deviation (Population) | 9.8% | 3.6% |
Similar Demographics by Unemployment Among Ages 35 to 44 years
Demographics Similar to Seminole by Unemployment Among Ages 35 to 44 years
In terms of unemployment among ages 35 to 44 years, the demographic groups most similar to Seminole are Cherokee (5.2%, a difference of 0.25%), Immigrants from Fiji (5.3%, a difference of 0.29%), Immigrants from Bahamas (5.2%, a difference of 0.31%), Mexican American Indian (5.2%, a difference of 0.34%), and Armenian (5.2%, a difference of 0.36%).
| Demographics | Rating | Rank | Unemployment Among Ages 35 to 44 years |
| Immigrants | Liberia | 0.2 /100 | #249 | Tragic 5.2% |
| Immigrants | El Salvador | 0.2 /100 | #250 | Tragic 5.2% |
| Comanche | 0.2 /100 | #251 | Tragic 5.2% |
| Armenians | 0.2 /100 | #252 | Tragic 5.2% |
| Mexican American Indians | 0.2 /100 | #253 | Tragic 5.2% |
| Immigrants | Bahamas | 0.2 /100 | #254 | Tragic 5.2% |
| Cherokee | 0.2 /100 | #255 | Tragic 5.2% |
| Seminole | 0.1 /100 | #256 | Tragic 5.2% |
| Immigrants | Fiji | 0.1 /100 | #257 | Tragic 5.3% |
| Immigrants | Latin America | 0.1 /100 | #258 | Tragic 5.3% |
| Mexicans | 0.1 /100 | #259 | Tragic 5.3% |
| Sub-Saharan Africans | 0.1 /100 | #260 | Tragic 5.3% |
| Spanish Americans | 0.1 /100 | #261 | Tragic 5.3% |
| Immigrants | Central America | 0.1 /100 | #262 | Tragic 5.3% |
| Choctaw | 0.1 /100 | #263 | Tragic 5.3% |
Demographics Similar to Immigrants from Guyana by Unemployment Among Ages 35 to 44 years
In terms of unemployment among ages 35 to 44 years, the demographic groups most similar to Immigrants from Guyana are British West Indian (6.0%, a difference of 0.12%), Immigrants from Dominica (6.0%, a difference of 0.49%), Marshallese (5.9%, a difference of 1.1%), Guyanese (5.9%, a difference of 1.4%), and Black/African American (6.1%, a difference of 2.3%).
| Demographics | Rating | Rank | Unemployment Among Ages 35 to 44 years |
| Belizeans | 0.0 /100 | #305 | Tragic 5.7% |
| Barbadians | 0.0 /100 | #306 | Tragic 5.7% |
| Immigrants | Belize | 0.0 /100 | #307 | Tragic 5.8% |
| Immigrants | Azores | 0.0 /100 | #308 | Tragic 5.8% |
| Immigrants | Barbados | 0.0 /100 | #309 | Tragic 5.8% |
| Guyanese | 0.0 /100 | #310 | Tragic 5.9% |
| Marshallese | 0.0 /100 | #311 | Tragic 5.9% |
| Immigrants | Guyana | 0.0 /100 | #312 | Tragic 6.0% |
| British West Indians | 0.0 /100 | #313 | Tragic 6.0% |
| Immigrants | Dominica | 0.0 /100 | #314 | Tragic 6.0% |
| Blacks/African Americans | 0.0 /100 | #315 | Tragic 6.1% |
| Tsimshian | 0.0 /100 | #316 | Tragic 6.2% |
| Immigrants | St. Vincent and the Grenadines | 0.0 /100 | #317 | Tragic 6.2% |
| Colville | 0.0 /100 | #318 | Tragic 6.2% |
| Immigrants | Grenada | 0.0 /100 | #319 | Tragic 6.2% |