Immigrants from Israel vs Immigrants from Australia Unemployment Among Women with Children Ages 6 to 17 years
COMPARE
Immigrants from Israel
Immigrants from Australia
Unemployment Among Women with Children Ages 6 to 17 years
Unemployment Among Women with Children Ages 6 to 17 years Comparison
Immigrants from Israel
Immigrants from Australia
8.5%
UNEMPLOYMENT AMONG WOMEN WITH CHILDREN AGES 6 TO 17 YEARS
99.1/ 100
METRIC RATING
87th/ 347
METRIC RANK
8.3%
UNEMPLOYMENT AMONG WOMEN WITH CHILDREN AGES 6 TO 17 YEARS
99.8/ 100
METRIC RATING
71st/ 347
METRIC RANK
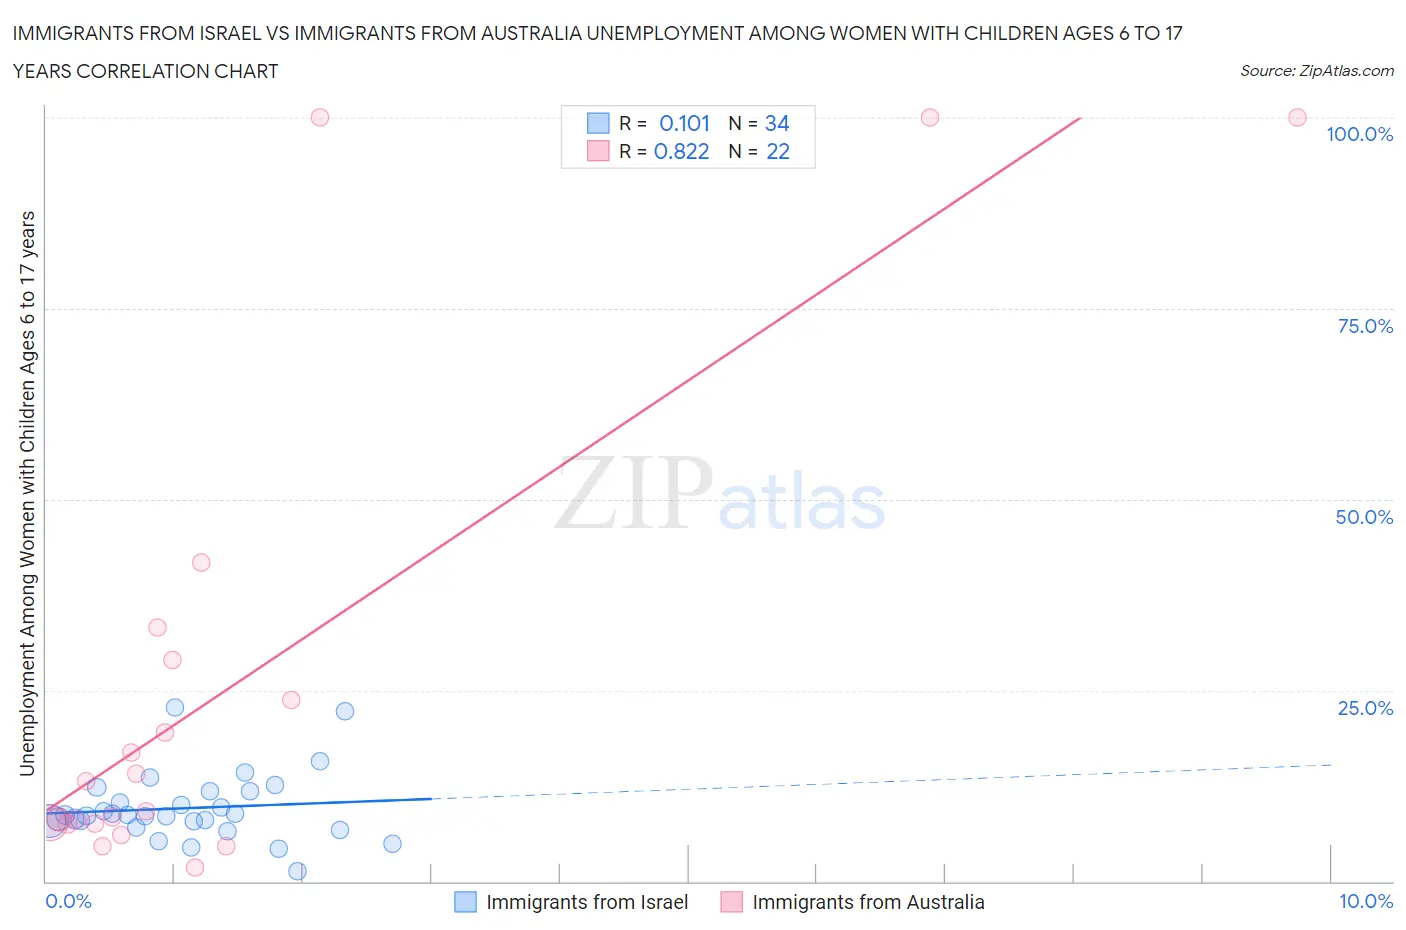
Immigrants from Israel vs Immigrants from Australia Unemployment Among Women with Children Ages 6 to 17 years Correlation Chart
The statistical analysis conducted on geographies consisting of 166,050,756 people shows a poor positive correlation between the proportion of Immigrants from Israel and unemployment rate among women with children between the ages 6 and 17 in the United States with a correlation coefficient (R) of 0.101 and weighted average of 8.5%. Similarly, the statistical analysis conducted on geographies consisting of 174,255,035 people shows a very strong positive correlation between the proportion of Immigrants from Australia and unemployment rate among women with children between the ages 6 and 17 in the United States with a correlation coefficient (R) of 0.822 and weighted average of 8.3%, a difference of 2.1%.
Unemployment Among Women with Children Ages 6 to 17 years Correlation Summary
| Measurement | Immigrants from Israel | Immigrants from Australia |
| Minimum | 1.3% | 1.8% |
| Maximum | 22.7% | 100.0% |
| Range | 21.4% | 98.2% |
| Mean | 9.6% | 25.7% |
| Median | 8.6% | 11.2% |
| Interquartile 25% (IQ1) | 7.8% | 7.6% |
| Interquartile 75% (IQ3) | 11.7% | 29.0% |
| Interquartile Range (IQR) | 3.9% | 21.5% |
| Standard Deviation (Sample) | 4.4% | 31.9% |
| Standard Deviation (Population) | 4.3% | 31.1% |
Demographics Similar to Immigrants from Israel and Immigrants from Australia by Unemployment Among Women with Children Ages 6 to 17 years
In terms of unemployment among women with children ages 6 to 17 years, the demographic groups most similar to Immigrants from Israel are Immigrants from Vietnam (8.5%, a difference of 0.020%), Paiute (8.5%, a difference of 0.10%), Alaskan Athabascan (8.5%, a difference of 0.33%), Immigrants from North Macedonia (8.5%, a difference of 0.48%), and Japanese (8.4%, a difference of 0.52%). Similarly, the demographic groups most similar to Immigrants from Australia are Immigrants from Nepal (8.3%, a difference of 0.040%), Norwegian (8.3%, a difference of 0.060%), Immigrants from Thailand (8.3%, a difference of 0.15%), Spanish American (8.4%, a difference of 0.41%), and Samoan (8.4%, a difference of 0.77%).
| Demographics | Rating | Rank | Unemployment Among Women with Children Ages 6 to 17 years |
| Immigrants | Thailand | 99.9 /100 | #69 | Exceptional 8.3% |
| Norwegians | 99.9 /100 | #70 | Exceptional 8.3% |
| Immigrants | Australia | 99.8 /100 | #71 | Exceptional 8.3% |
| Immigrants | Nepal | 99.8 /100 | #72 | Exceptional 8.3% |
| Spanish Americans | 99.8 /100 | #73 | Exceptional 8.4% |
| Samoans | 99.7 /100 | #74 | Exceptional 8.4% |
| Immigrants | Sri Lanka | 99.7 /100 | #75 | Exceptional 8.4% |
| Immigrants | Moldova | 99.7 /100 | #76 | Exceptional 8.4% |
| Iraqis | 99.7 /100 | #77 | Exceptional 8.4% |
| Pakistanis | 99.6 /100 | #78 | Exceptional 8.4% |
| Mongolians | 99.6 /100 | #79 | Exceptional 8.4% |
| Immigrants | Belarus | 99.6 /100 | #80 | Exceptional 8.4% |
| Immigrants | Bolivia | 99.6 /100 | #81 | Exceptional 8.4% |
| Cypriots | 99.6 /100 | #82 | Exceptional 8.4% |
| Bulgarians | 99.5 /100 | #83 | Exceptional 8.4% |
| Japanese | 99.5 /100 | #84 | Exceptional 8.4% |
| Immigrants | North Macedonia | 99.4 /100 | #85 | Exceptional 8.5% |
| Alaskan Athabascans | 99.4 /100 | #86 | Exceptional 8.5% |
| Immigrants | Israel | 99.1 /100 | #87 | Exceptional 8.5% |
| Immigrants | Vietnam | 99.1 /100 | #88 | Exceptional 8.5% |
| Paiute | 99.1 /100 | #89 | Exceptional 8.5% |