Blackfeet vs Assyrian/Chaldean/Syriac Unemployment Among Ages 30 to 34 years
COMPARE
Blackfeet
Assyrian/Chaldean/Syriac
Unemployment Among Ages 30 to 34 years
Unemployment Among Ages 30 to 34 years Comparison
Blackfeet
Assyrians/Chaldeans/Syriacs
6.3%
UNEMPLOYMENT AMONG AGES 30 TO 34 YEARS
0.0/ 100
METRIC RATING
272nd/ 347
METRIC RANK
5.1%
UNEMPLOYMENT AMONG AGES 30 TO 34 YEARS
98.4/ 100
METRIC RATING
48th/ 347
METRIC RANK
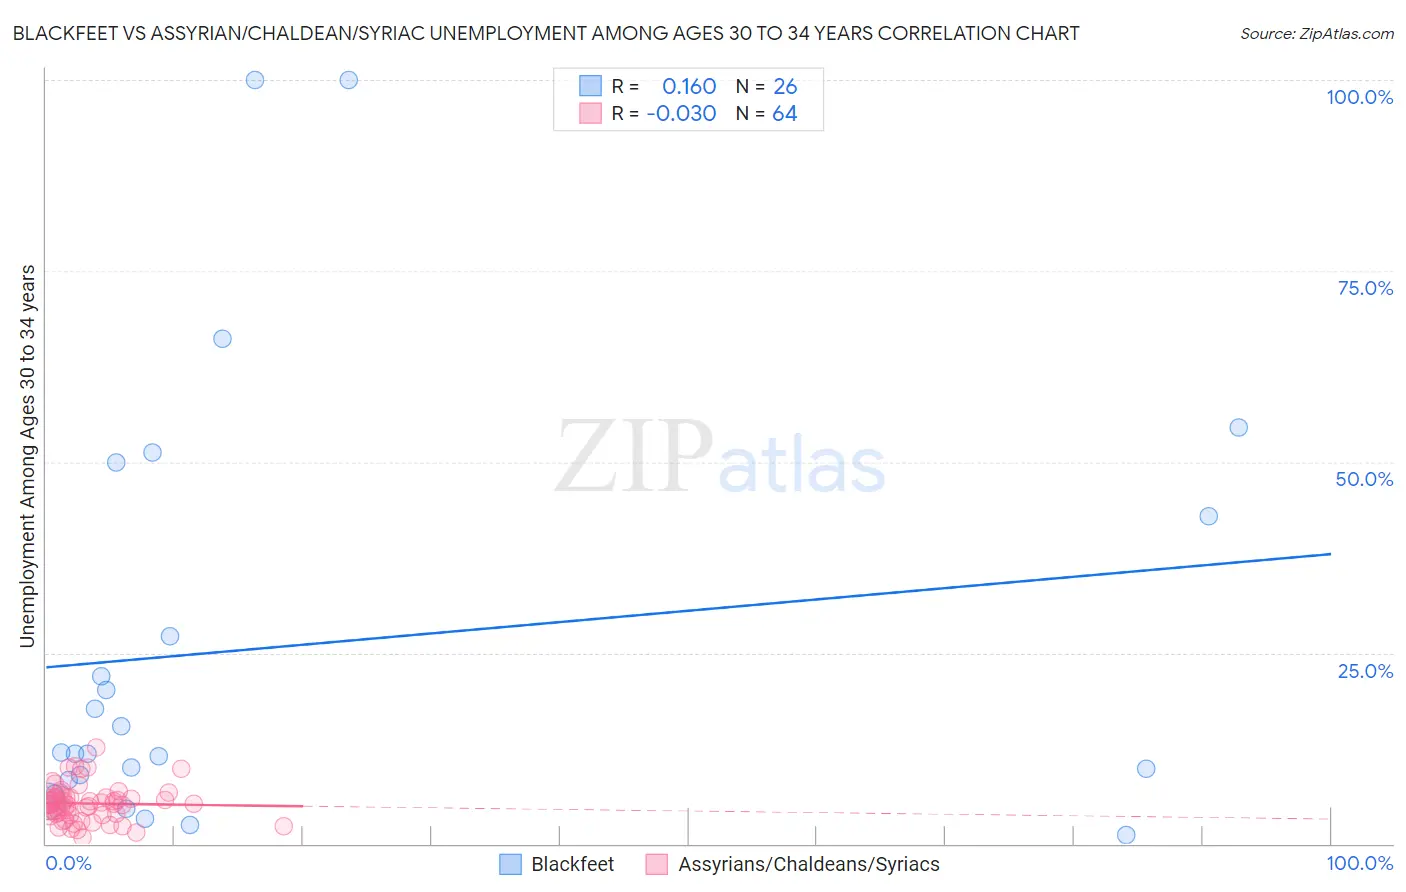
Blackfeet vs Assyrian/Chaldean/Syriac Unemployment Among Ages 30 to 34 years Correlation Chart
The statistical analysis conducted on geographies consisting of 294,748,447 people shows a poor positive correlation between the proportion of Blackfeet and unemployment rate among population between the ages 30 and 34 in the United States with a correlation coefficient (R) of 0.160 and weighted average of 6.3%. Similarly, the statistical analysis conducted on geographies consisting of 108,429,233 people shows no correlation between the proportion of Assyrians/Chaldeans/Syriacs and unemployment rate among population between the ages 30 and 34 in the United States with a correlation coefficient (R) of -0.030 and weighted average of 5.1%, a difference of 23.7%.
Unemployment Among Ages 30 to 34 years Correlation Summary
| Measurement | Blackfeet | Assyrian/Chaldean/Syriac |
| Minimum | 1.2% | 0.80% |
| Maximum | 100.0% | 12.6% |
| Range | 98.8% | 11.8% |
| Mean | 25.9% | 5.3% |
| Median | 11.9% | 5.2% |
| Interquartile 25% (IQ1) | 8.4% | 3.8% |
| Interquartile 75% (IQ3) | 42.9% | 6.1% |
| Interquartile Range (IQR) | 34.5% | 2.3% |
| Standard Deviation (Sample) | 28.3% | 2.3% |
| Standard Deviation (Population) | 27.7% | 2.3% |
Similar Demographics by Unemployment Among Ages 30 to 34 years
Demographics Similar to Blackfeet by Unemployment Among Ages 30 to 34 years
In terms of unemployment among ages 30 to 34 years, the demographic groups most similar to Blackfeet are Ottawa (6.3%, a difference of 0.010%), U.S. Virgin Islander (6.3%, a difference of 0.020%), Comanche (6.3%, a difference of 0.11%), Ecuadorian (6.3%, a difference of 0.13%), and Pennsylvania German (6.3%, a difference of 0.18%).
| Demographics | Rating | Rank | Unemployment Among Ages 30 to 34 years |
| Americans | 0.0 /100 | #265 | Tragic 6.2% |
| Seminole | 0.0 /100 | #266 | Tragic 6.2% |
| Immigrants | Mexico | 0.0 /100 | #267 | Tragic 6.2% |
| Immigrants | Haiti | 0.0 /100 | #268 | Tragic 6.2% |
| French American Indians | 0.0 /100 | #269 | Tragic 6.3% |
| Immigrants | Senegal | 0.0 /100 | #270 | Tragic 6.3% |
| Comanche | 0.0 /100 | #271 | Tragic 6.3% |
| Blackfeet | 0.0 /100 | #272 | Tragic 6.3% |
| Ottawa | 0.0 /100 | #273 | Tragic 6.3% |
| U.S. Virgin Islanders | 0.0 /100 | #274 | Tragic 6.3% |
| Ecuadorians | 0.0 /100 | #275 | Tragic 6.3% |
| Pennsylvania Germans | 0.0 /100 | #276 | Tragic 6.3% |
| Immigrants | Ecuador | 0.0 /100 | #277 | Tragic 6.3% |
| Osage | 0.0 /100 | #278 | Tragic 6.3% |
| Cree | 0.0 /100 | #279 | Tragic 6.4% |
Demographics Similar to Assyrians/Chaldeans/Syriacs by Unemployment Among Ages 30 to 34 years
In terms of unemployment among ages 30 to 34 years, the demographic groups most similar to Assyrians/Chaldeans/Syriacs are Cypriot (5.1%, a difference of 0.020%), Immigrants from Congo (5.1%, a difference of 0.040%), Immigrants from Malaysia (5.1%, a difference of 0.12%), Puget Sound Salish (5.1%, a difference of 0.20%), and Turkish (5.1%, a difference of 0.23%).
| Demographics | Rating | Rank | Unemployment Among Ages 30 to 34 years |
| Immigrants | Eastern Africa | 98.9 /100 | #41 | Exceptional 5.0% |
| Immigrants | Hong Kong | 98.8 /100 | #42 | Exceptional 5.0% |
| Soviet Union | 98.8 /100 | #43 | Exceptional 5.0% |
| Immigrants | Belgium | 98.7 /100 | #44 | Exceptional 5.1% |
| Yugoslavians | 98.6 /100 | #45 | Exceptional 5.1% |
| Immigrants | Congo | 98.4 /100 | #46 | Exceptional 5.1% |
| Cypriots | 98.4 /100 | #47 | Exceptional 5.1% |
| Assyrians/Chaldeans/Syriacs | 98.4 /100 | #48 | Exceptional 5.1% |
| Immigrants | Malaysia | 98.3 /100 | #49 | Exceptional 5.1% |
| Puget Sound Salish | 98.2 /100 | #50 | Exceptional 5.1% |
| Turks | 98.2 /100 | #51 | Exceptional 5.1% |
| Immigrants | Burma/Myanmar | 98.1 /100 | #52 | Exceptional 5.1% |
| Cubans | 98.1 /100 | #53 | Exceptional 5.1% |
| Immigrants | Morocco | 97.9 /100 | #54 | Exceptional 5.1% |
| Chinese | 97.7 /100 | #55 | Exceptional 5.1% |