Native/Alaskan vs Bangladeshi Unemployment Among Ages 30 to 34 years
COMPARE
Native/Alaskan
Bangladeshi
Unemployment Among Ages 30 to 34 years
Unemployment Among Ages 30 to 34 years Comparison
Natives/Alaskans
Bangladeshis
8.2%
UNEMPLOYMENT AMONG AGES 30 TO 34 YEARS
0.0/ 100
METRIC RATING
332nd/ 347
METRIC RANK
5.3%
UNEMPLOYMENT AMONG AGES 30 TO 34 YEARS
76.6/ 100
METRIC RATING
134th/ 347
METRIC RANK
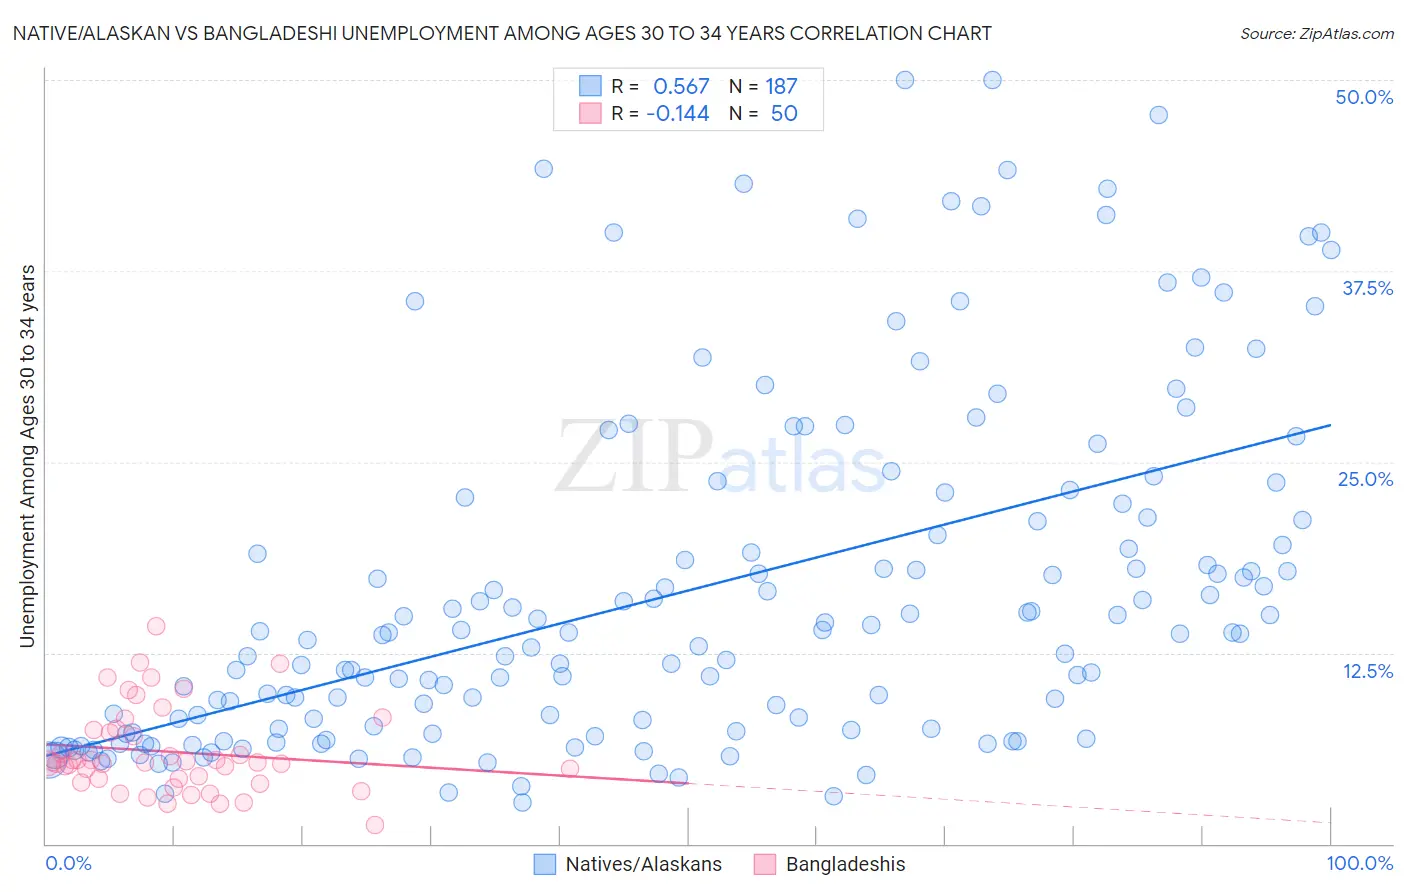
Native/Alaskan vs Bangladeshi Unemployment Among Ages 30 to 34 years Correlation Chart
The statistical analysis conducted on geographies consisting of 466,883,769 people shows a substantial positive correlation between the proportion of Natives/Alaskans and unemployment rate among population between the ages 30 and 34 in the United States with a correlation coefficient (R) of 0.567 and weighted average of 8.2%. Similarly, the statistical analysis conducted on geographies consisting of 137,750,600 people shows a poor negative correlation between the proportion of Bangladeshis and unemployment rate among population between the ages 30 and 34 in the United States with a correlation coefficient (R) of -0.144 and weighted average of 5.3%, a difference of 54.0%.
Unemployment Among Ages 30 to 34 years Correlation Summary
| Measurement | Native/Alaskan | Bangladeshi |
| Minimum | 2.7% | 1.2% |
| Maximum | 50.0% | 14.2% |
| Range | 47.3% | 13.0% |
| Mean | 16.5% | 6.0% |
| Median | 13.7% | 5.3% |
| Interquartile 25% (IQ1) | 7.4% | 4.2% |
| Interquartile 75% (IQ3) | 21.4% | 7.4% |
| Interquartile Range (IQR) | 14.0% | 3.2% |
| Standard Deviation (Sample) | 11.3% | 2.8% |
| Standard Deviation (Population) | 11.3% | 2.8% |
Similar Demographics by Unemployment Among Ages 30 to 34 years
Demographics Similar to Natives/Alaskans by Unemployment Among Ages 30 to 34 years
In terms of unemployment among ages 30 to 34 years, the demographic groups most similar to Natives/Alaskans are Pueblo (8.3%, a difference of 0.43%), Sioux (8.0%, a difference of 2.6%), Alaska Native (8.5%, a difference of 3.1%), Shoshone (7.9%, a difference of 4.1%), and Cheyenne (7.8%, a difference of 5.1%).
| Demographics | Rating | Rank | Unemployment Among Ages 30 to 34 years |
| Apache | 0.0 /100 | #325 | Tragic 7.3% |
| Dominicans | 0.0 /100 | #326 | Tragic 7.7% |
| Immigrants | Dominican Republic | 0.0 /100 | #327 | Tragic 7.7% |
| Chippewa | 0.0 /100 | #328 | Tragic 7.8% |
| Cheyenne | 0.0 /100 | #329 | Tragic 7.8% |
| Shoshone | 0.0 /100 | #330 | Tragic 7.9% |
| Sioux | 0.0 /100 | #331 | Tragic 8.0% |
| Natives/Alaskans | 0.0 /100 | #332 | Tragic 8.2% |
| Pueblo | 0.0 /100 | #333 | Tragic 8.3% |
| Alaska Natives | 0.0 /100 | #334 | Tragic 8.5% |
| Puerto Ricans | 0.0 /100 | #335 | Tragic 8.9% |
| Colville | 0.0 /100 | #336 | Tragic 9.0% |
| Pima | 0.0 /100 | #337 | Tragic 9.6% |
| Yakama | 0.0 /100 | #338 | Tragic 9.8% |
| Tohono O'odham | 0.0 /100 | #339 | Tragic 9.8% |
Demographics Similar to Bangladeshis by Unemployment Among Ages 30 to 34 years
In terms of unemployment among ages 30 to 34 years, the demographic groups most similar to Bangladeshis are Carpatho Rusyn (5.3%, a difference of 0.070%), Immigrants from Northern Europe (5.3%, a difference of 0.070%), Immigrants from Eastern Europe (5.3%, a difference of 0.080%), German (5.3%, a difference of 0.12%), and Palestinian (5.4%, a difference of 0.14%).
| Demographics | Rating | Rank | Unemployment Among Ages 30 to 34 years |
| Taiwanese | 79.4 /100 | #127 | Good 5.3% |
| Immigrants | Uruguay | 79.3 /100 | #128 | Good 5.3% |
| Poles | 78.8 /100 | #129 | Good 5.3% |
| Germans | 77.8 /100 | #130 | Good 5.3% |
| Immigrants | Eastern Europe | 77.4 /100 | #131 | Good 5.3% |
| Carpatho Rusyns | 77.3 /100 | #132 | Good 5.3% |
| Immigrants | Northern Europe | 77.3 /100 | #133 | Good 5.3% |
| Bangladeshis | 76.6 /100 | #134 | Good 5.3% |
| Palestinians | 75.1 /100 | #135 | Good 5.4% |
| Pakistanis | 74.6 /100 | #136 | Good 5.4% |
| Immigrants | Canada | 74.6 /100 | #137 | Good 5.4% |
| Serbians | 72.9 /100 | #138 | Good 5.4% |
| Lithuanians | 72.4 /100 | #139 | Good 5.4% |
| Immigrants | North America | 72.2 /100 | #140 | Good 5.4% |
| Immigrants | Europe | 72.1 /100 | #141 | Good 5.4% |