Moroccan vs Immigrants from Lebanon Male Unemployment
COMPARE
Moroccan
Immigrants from Lebanon
Male Unemployment
Male Unemployment Comparison
Moroccans
Immigrants from Lebanon
5.6%
MALE UNEMPLOYMENT
1.6/ 100
METRIC RATING
232nd/ 347
METRIC RANK
5.5%
MALE UNEMPLOYMENT
8.6/ 100
METRIC RATING
208th/ 347
METRIC RANK
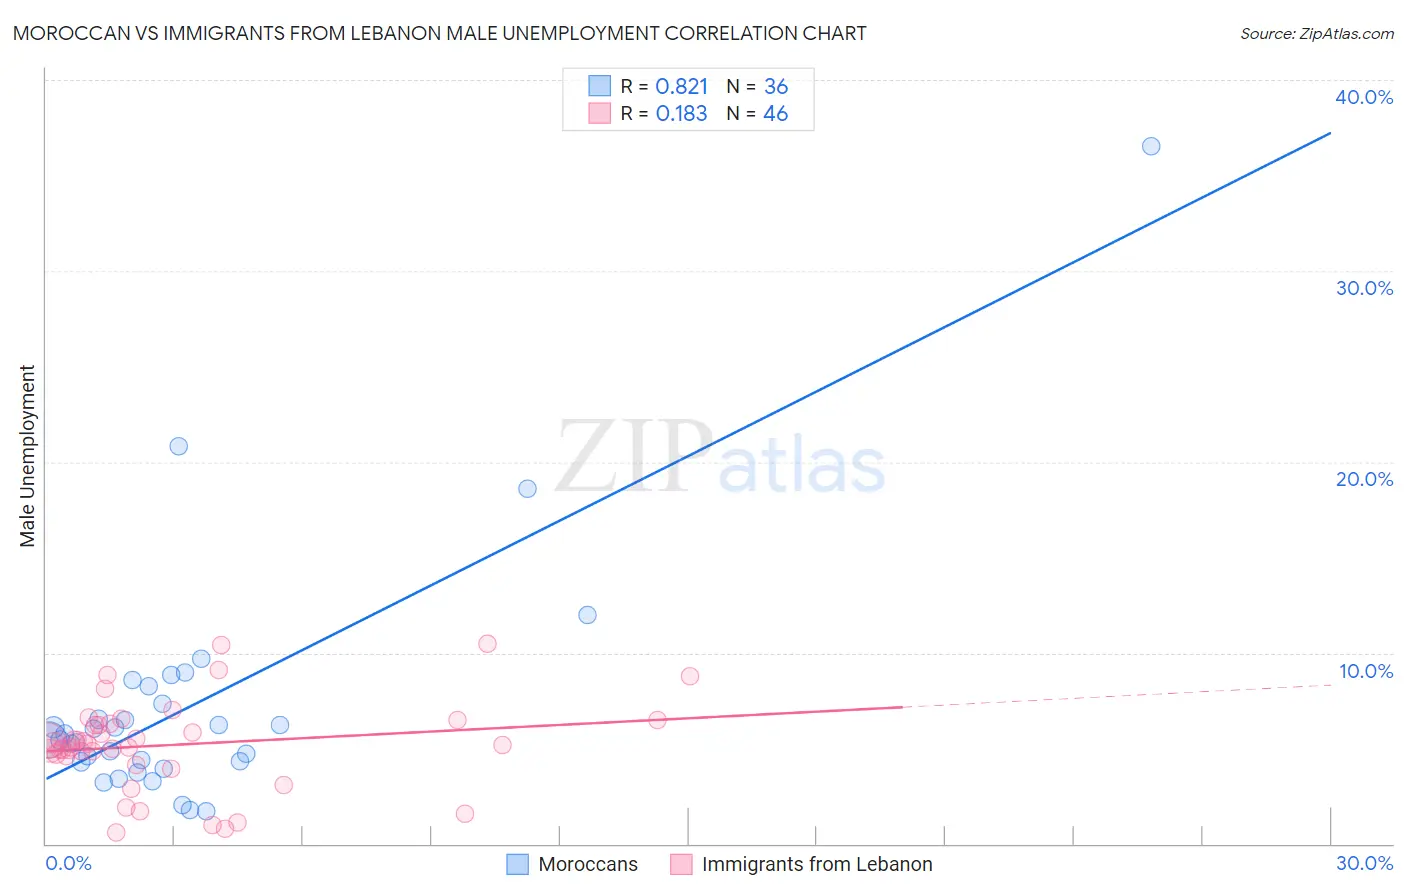
Moroccan vs Immigrants from Lebanon Male Unemployment Correlation Chart
The statistical analysis conducted on geographies consisting of 201,559,646 people shows a very strong positive correlation between the proportion of Moroccans and unemployment rate among males in the United States with a correlation coefficient (R) of 0.821 and weighted average of 5.6%. Similarly, the statistical analysis conducted on geographies consisting of 216,995,040 people shows a poor positive correlation between the proportion of Immigrants from Lebanon and unemployment rate among males in the United States with a correlation coefficient (R) of 0.183 and weighted average of 5.5%, a difference of 2.5%.
Male Unemployment Correlation Summary
| Measurement | Moroccan | Immigrants from Lebanon |
| Minimum | 1.7% | 0.59% |
| Maximum | 36.5% | 10.5% |
| Range | 34.8% | 9.9% |
| Mean | 7.2% | 5.2% |
| Median | 5.6% | 5.2% |
| Interquartile 25% (IQ1) | 4.3% | 4.6% |
| Interquartile 75% (IQ3) | 7.8% | 6.3% |
| Interquartile Range (IQR) | 3.5% | 1.7% |
| Standard Deviation (Sample) | 6.4% | 2.3% |
| Standard Deviation (Population) | 6.3% | 2.3% |
Similar Demographics by Male Unemployment
Demographics Similar to Moroccans by Male Unemployment
In terms of male unemployment, the demographic groups most similar to Moroccans are Choctaw (5.6%, a difference of 0.030%), Somali (5.6%, a difference of 0.080%), Immigrants from Somalia (5.6%, a difference of 0.080%), Immigrants from Africa (5.6%, a difference of 0.090%), and Immigrants from Honduras (5.6%, a difference of 0.11%).
| Demographics | Rating | Rank | Male Unemployment |
| Panamanians | 1.9 /100 | #225 | Tragic 5.6% |
| Immigrants | Cambodia | 1.8 /100 | #226 | Tragic 5.6% |
| Immigrants | Panama | 1.8 /100 | #227 | Tragic 5.6% |
| Seminole | 1.8 /100 | #228 | Tragic 5.6% |
| Central Americans | 1.8 /100 | #229 | Tragic 5.6% |
| Immigrants | Africa | 1.7 /100 | #230 | Tragic 5.6% |
| Choctaw | 1.6 /100 | #231 | Tragic 5.6% |
| Moroccans | 1.6 /100 | #232 | Tragic 5.6% |
| Somalis | 1.5 /100 | #233 | Tragic 5.6% |
| Immigrants | Somalia | 1.5 /100 | #234 | Tragic 5.6% |
| Immigrants | Honduras | 1.5 /100 | #235 | Tragic 5.6% |
| Guatemalans | 1.2 /100 | #236 | Tragic 5.6% |
| Hondurans | 1.1 /100 | #237 | Tragic 5.6% |
| Native Hawaiians | 1.1 /100 | #238 | Tragic 5.6% |
| Immigrants | Guatemala | 1.1 /100 | #239 | Tragic 5.6% |
Demographics Similar to Immigrants from Lebanon by Male Unemployment
In terms of male unemployment, the demographic groups most similar to Immigrants from Lebanon are Immigrants from Middle Africa (5.5%, a difference of 0.050%), Immigrants from Syria (5.5%, a difference of 0.13%), South American Indian (5.5%, a difference of 0.18%), Israeli (5.5%, a difference of 0.22%), and Immigrants from Ukraine (5.5%, a difference of 0.23%).
| Demographics | Rating | Rank | Male Unemployment |
| Immigrants | Philippines | 13.5 /100 | #201 | Poor 5.4% |
| Immigrants | Nonimmigrants | 13.1 /100 | #202 | Poor 5.4% |
| Immigrants | Laos | 13.0 /100 | #203 | Poor 5.4% |
| Guamanians/Chamorros | 12.3 /100 | #204 | Poor 5.4% |
| Immigrants | Costa Rica | 11.4 /100 | #205 | Poor 5.5% |
| Immigrants | Ukraine | 9.9 /100 | #206 | Tragic 5.5% |
| Immigrants | Syria | 9.3 /100 | #207 | Tragic 5.5% |
| Immigrants | Lebanon | 8.6 /100 | #208 | Tragic 5.5% |
| Immigrants | Middle Africa | 8.3 /100 | #209 | Tragic 5.5% |
| South American Indians | 7.6 /100 | #210 | Tragic 5.5% |
| Israelis | 7.4 /100 | #211 | Tragic 5.5% |
| Hmong | 7.0 /100 | #212 | Tragic 5.5% |
| Ugandans | 6.3 /100 | #213 | Tragic 5.5% |
| Puget Sound Salish | 5.6 /100 | #214 | Tragic 5.5% |
| Samoans | 4.9 /100 | #215 | Tragic 5.5% |