Moroccan vs Immigrants from Eastern Europe Male Unemployment
COMPARE
Moroccan
Immigrants from Eastern Europe
Male Unemployment
Male Unemployment Comparison
Moroccans
Immigrants from Eastern Europe
5.6%
MALE UNEMPLOYMENT
1.6/ 100
METRIC RATING
232nd/ 347
METRIC RANK
5.3%
MALE UNEMPLOYMENT
54.1/ 100
METRIC RATING
170th/ 347
METRIC RANK
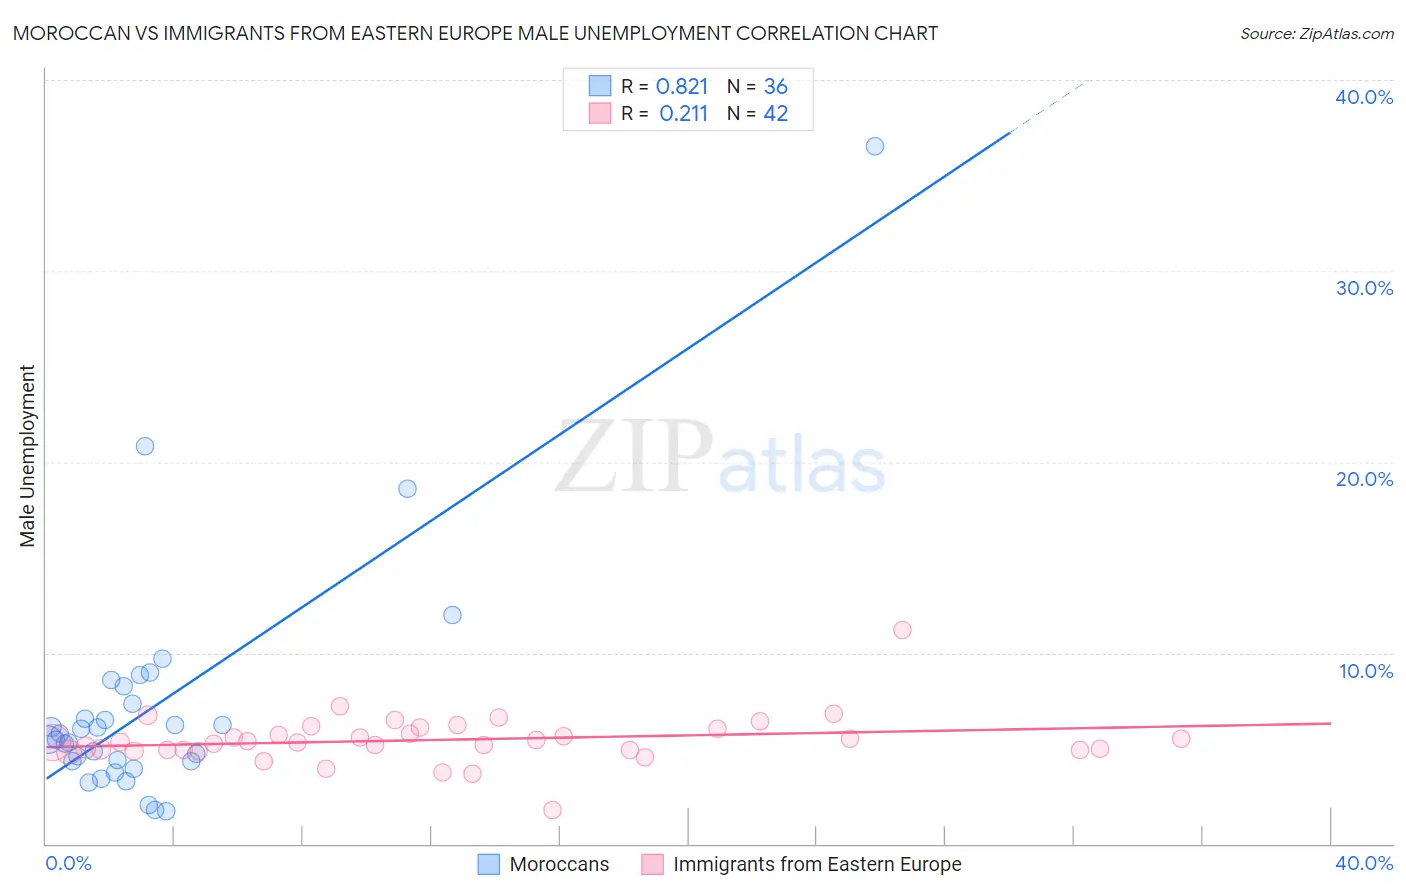
Moroccan vs Immigrants from Eastern Europe Male Unemployment Correlation Chart
The statistical analysis conducted on geographies consisting of 201,559,646 people shows a very strong positive correlation between the proportion of Moroccans and unemployment rate among males in the United States with a correlation coefficient (R) of 0.821 and weighted average of 5.6%. Similarly, the statistical analysis conducted on geographies consisting of 472,485,071 people shows a weak positive correlation between the proportion of Immigrants from Eastern Europe and unemployment rate among males in the United States with a correlation coefficient (R) of 0.211 and weighted average of 5.3%, a difference of 6.3%.
Male Unemployment Correlation Summary
| Measurement | Moroccan | Immigrants from Eastern Europe |
| Minimum | 1.7% | 1.8% |
| Maximum | 36.5% | 11.2% |
| Range | 34.8% | 9.4% |
| Mean | 7.2% | 5.4% |
| Median | 5.6% | 5.3% |
| Interquartile 25% (IQ1) | 4.3% | 4.9% |
| Interquartile 75% (IQ3) | 7.8% | 6.0% |
| Interquartile Range (IQR) | 3.5% | 1.1% |
| Standard Deviation (Sample) | 6.4% | 1.3% |
| Standard Deviation (Population) | 6.3% | 1.3% |
Similar Demographics by Male Unemployment
Demographics Similar to Moroccans by Male Unemployment
In terms of male unemployment, the demographic groups most similar to Moroccans are Choctaw (5.6%, a difference of 0.030%), Somali (5.6%, a difference of 0.080%), Immigrants from Somalia (5.6%, a difference of 0.080%), Immigrants from Africa (5.6%, a difference of 0.090%), and Immigrants from Honduras (5.6%, a difference of 0.11%).
| Demographics | Rating | Rank | Male Unemployment |
| Panamanians | 1.9 /100 | #225 | Tragic 5.6% |
| Immigrants | Cambodia | 1.8 /100 | #226 | Tragic 5.6% |
| Immigrants | Panama | 1.8 /100 | #227 | Tragic 5.6% |
| Seminole | 1.8 /100 | #228 | Tragic 5.6% |
| Central Americans | 1.8 /100 | #229 | Tragic 5.6% |
| Immigrants | Africa | 1.7 /100 | #230 | Tragic 5.6% |
| Choctaw | 1.6 /100 | #231 | Tragic 5.6% |
| Moroccans | 1.6 /100 | #232 | Tragic 5.6% |
| Somalis | 1.5 /100 | #233 | Tragic 5.6% |
| Immigrants | Somalia | 1.5 /100 | #234 | Tragic 5.6% |
| Immigrants | Honduras | 1.5 /100 | #235 | Tragic 5.6% |
| Guatemalans | 1.2 /100 | #236 | Tragic 5.6% |
| Hondurans | 1.1 /100 | #237 | Tragic 5.6% |
| Native Hawaiians | 1.1 /100 | #238 | Tragic 5.6% |
| Immigrants | Guatemala | 1.1 /100 | #239 | Tragic 5.6% |
Demographics Similar to Immigrants from Eastern Europe by Male Unemployment
In terms of male unemployment, the demographic groups most similar to Immigrants from Eastern Europe are Peruvian (5.3%, a difference of 0.13%), Immigrants from Kazakhstan (5.3%, a difference of 0.19%), Immigrants from Congo (5.3%, a difference of 0.20%), Immigrants from Russia (5.3%, a difference of 0.20%), and Immigrants from Ireland (5.3%, a difference of 0.22%).
| Demographics | Rating | Rank | Male Unemployment |
| Immigrants | Hong Kong | 65.7 /100 | #163 | Good 5.2% |
| Afghans | 62.0 /100 | #164 | Good 5.3% |
| South Americans | 60.6 /100 | #165 | Good 5.3% |
| Immigrants | Morocco | 60.2 /100 | #166 | Good 5.3% |
| Immigrants | Vietnam | 58.1 /100 | #167 | Average 5.3% |
| Immigrants | Ireland | 57.7 /100 | #168 | Average 5.3% |
| Immigrants | Congo | 57.4 /100 | #169 | Average 5.3% |
| Immigrants | Eastern Europe | 54.1 /100 | #170 | Average 5.3% |
| Peruvians | 51.9 /100 | #171 | Average 5.3% |
| Immigrants | Kazakhstan | 50.8 /100 | #172 | Average 5.3% |
| Immigrants | Russia | 50.7 /100 | #173 | Average 5.3% |
| Immigrants | Iran | 50.0 /100 | #174 | Average 5.3% |
| Immigrants | Iraq | 48.1 /100 | #175 | Average 5.3% |
| Immigrants | Poland | 46.0 /100 | #176 | Average 5.3% |
| Immigrants | Peru | 44.6 /100 | #177 | Average 5.3% |