Immigrants from South America vs Immigrants from Lebanon Male Unemployment
COMPARE
Immigrants from South America
Immigrants from Lebanon
Male Unemployment
Male Unemployment Comparison
Immigrants from South America
Immigrants from Lebanon
5.4%
MALE UNEMPLOYMENT
29.4/ 100
METRIC RATING
189th/ 347
METRIC RANK
5.5%
MALE UNEMPLOYMENT
8.6/ 100
METRIC RATING
208th/ 347
METRIC RANK
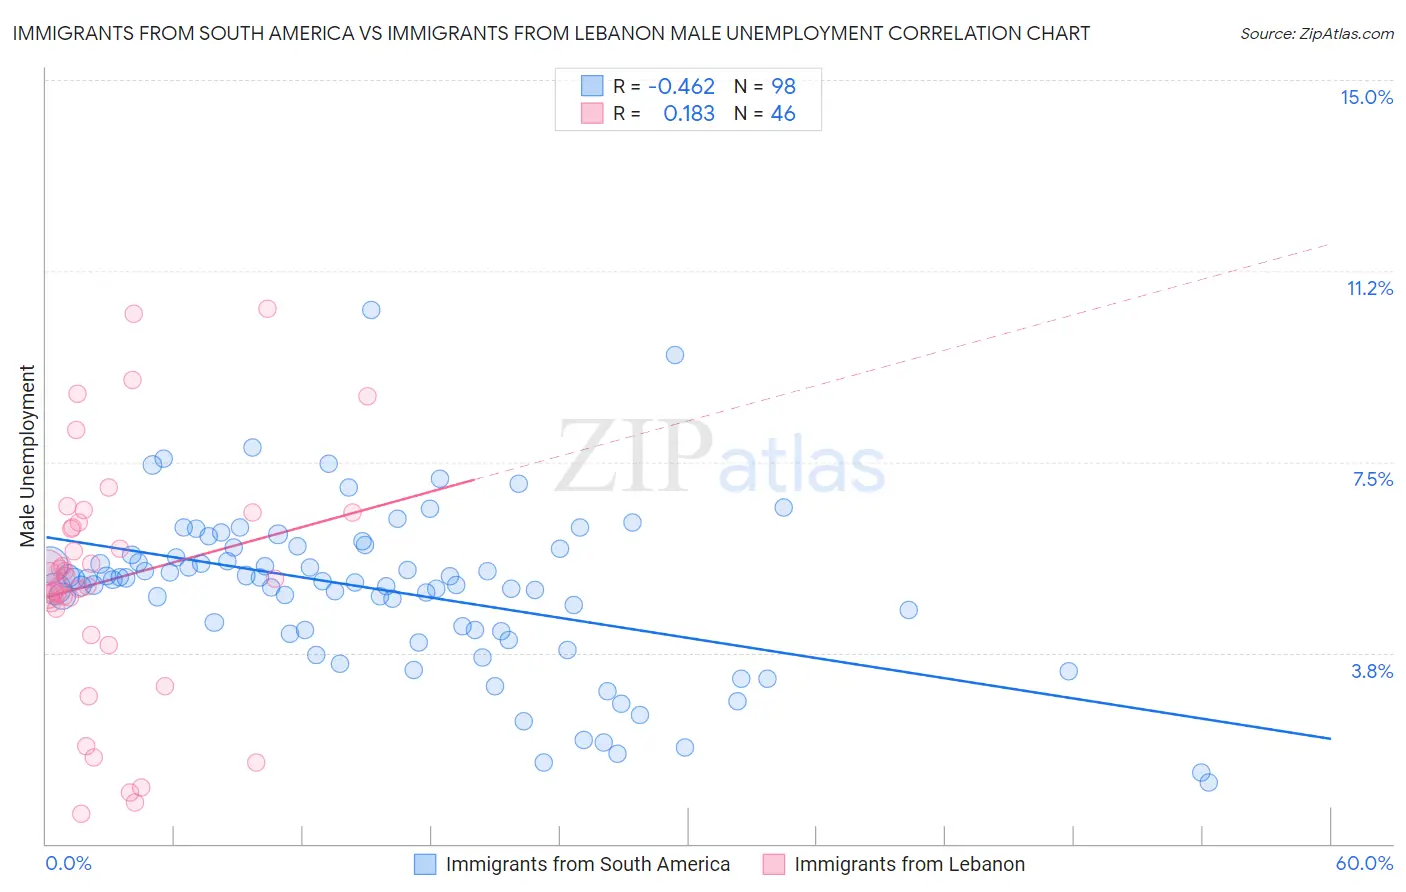
Immigrants from South America vs Immigrants from Lebanon Male Unemployment Correlation Chart
The statistical analysis conducted on geographies consisting of 483,078,598 people shows a moderate negative correlation between the proportion of Immigrants from South America and unemployment rate among males in the United States with a correlation coefficient (R) of -0.462 and weighted average of 5.4%. Similarly, the statistical analysis conducted on geographies consisting of 216,995,040 people shows a poor positive correlation between the proportion of Immigrants from Lebanon and unemployment rate among males in the United States with a correlation coefficient (R) of 0.183 and weighted average of 5.5%, a difference of 2.1%.
Male Unemployment Correlation Summary
| Measurement | Immigrants from South America | Immigrants from Lebanon |
| Minimum | 1.2% | 0.59% |
| Maximum | 10.5% | 10.5% |
| Range | 9.3% | 9.9% |
| Mean | 5.0% | 5.2% |
| Median | 5.2% | 5.2% |
| Interquartile 25% (IQ1) | 4.2% | 4.6% |
| Interquartile 75% (IQ3) | 5.8% | 6.3% |
| Interquartile Range (IQR) | 1.6% | 1.7% |
| Standard Deviation (Sample) | 1.6% | 2.3% |
| Standard Deviation (Population) | 1.6% | 2.3% |
Demographics Similar to Immigrants from South America and Immigrants from Lebanon by Male Unemployment
In terms of male unemployment, the demographic groups most similar to Immigrants from South America are Immigrants from Uganda (5.4%, a difference of 0.040%), Arab (5.4%, a difference of 0.060%), Immigrants from South Eastern Asia (5.4%, a difference of 0.080%), Immigrants from Belarus (5.4%, a difference of 0.24%), and Immigrants from Israel (5.4%, a difference of 0.30%). Similarly, the demographic groups most similar to Immigrants from Lebanon are Immigrants from Syria (5.5%, a difference of 0.13%), Immigrants from Ukraine (5.5%, a difference of 0.23%), Immigrants from Costa Rica (5.5%, a difference of 0.45%), Guamanian/Chamorro (5.4%, a difference of 0.58%), and Immigrants from Laos (5.4%, a difference of 0.67%).
| Demographics | Rating | Rank | Male Unemployment |
| Arabs | 30.2 /100 | #188 | Fair 5.4% |
| Immigrants | South America | 29.4 /100 | #189 | Fair 5.4% |
| Immigrants | Uganda | 28.8 /100 | #190 | Fair 5.4% |
| Immigrants | South Eastern Asia | 28.2 /100 | #191 | Fair 5.4% |
| Immigrants | Belarus | 26.0 /100 | #192 | Fair 5.4% |
| Immigrants | Israel | 25.2 /100 | #193 | Fair 5.4% |
| Spanish | 19.7 /100 | #194 | Poor 5.4% |
| Immigrants | Southern Europe | 17.7 /100 | #195 | Poor 5.4% |
| Albanians | 17.3 /100 | #196 | Poor 5.4% |
| Alsatians | 16.7 /100 | #197 | Poor 5.4% |
| Immigrants | Thailand | 14.7 /100 | #198 | Poor 5.4% |
| Immigrants | Greece | 14.5 /100 | #199 | Poor 5.4% |
| Immigrants | Zaire | 13.7 /100 | #200 | Poor 5.4% |
| Immigrants | Philippines | 13.5 /100 | #201 | Poor 5.4% |
| Immigrants | Nonimmigrants | 13.1 /100 | #202 | Poor 5.4% |
| Immigrants | Laos | 13.0 /100 | #203 | Poor 5.4% |
| Guamanians/Chamorros | 12.3 /100 | #204 | Poor 5.4% |
| Immigrants | Costa Rica | 11.4 /100 | #205 | Poor 5.5% |
| Immigrants | Ukraine | 9.9 /100 | #206 | Tragic 5.5% |
| Immigrants | Syria | 9.3 /100 | #207 | Tragic 5.5% |
| Immigrants | Lebanon | 8.6 /100 | #208 | Tragic 5.5% |