Trinidadian and Tobagonian vs Delaware Unemployment Among Ages 45 to 54 years
COMPARE
Trinidadian and Tobagonian
Delaware
Unemployment Among Ages 45 to 54 years
Unemployment Among Ages 45 to 54 years Comparison
Trinidadians and Tobagonians
Delaware
5.2%
UNEMPLOYMENT AMONG AGES 45 TO 54 YEARS
0.0/ 100
METRIC RATING
292nd/ 347
METRIC RANK
4.8%
UNEMPLOYMENT AMONG AGES 45 TO 54 YEARS
1.3/ 100
METRIC RATING
241st/ 347
METRIC RANK
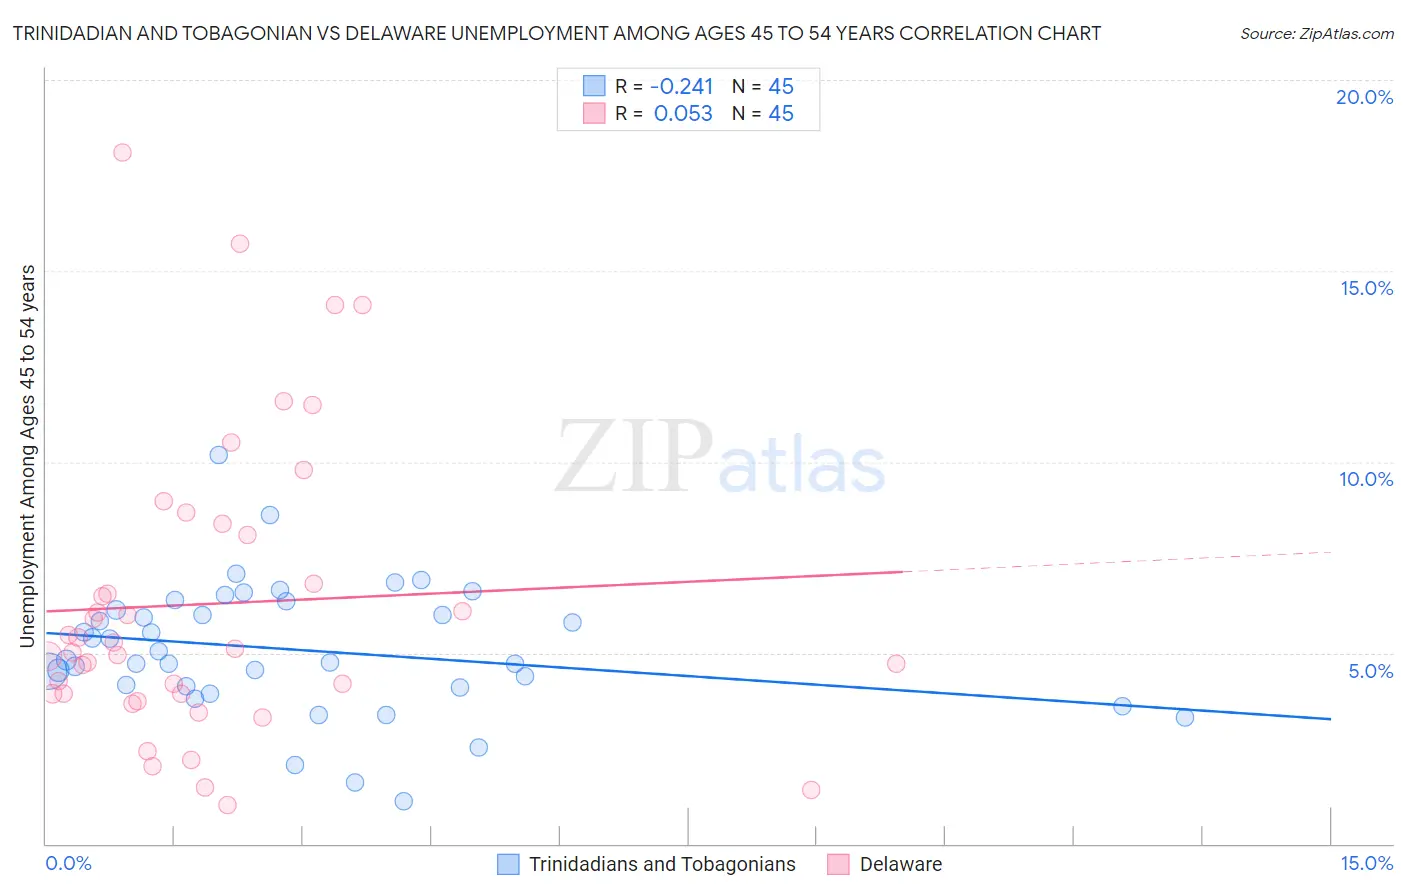
Trinidadian and Tobagonian vs Delaware Unemployment Among Ages 45 to 54 years Correlation Chart
The statistical analysis conducted on geographies consisting of 216,980,624 people shows a weak negative correlation between the proportion of Trinidadians and Tobagonians and unemployment rate among population between the ages 45 and 54 in the United States with a correlation coefficient (R) of -0.241 and weighted average of 5.2%. Similarly, the statistical analysis conducted on geographies consisting of 95,085,648 people shows a slight positive correlation between the proportion of Delaware and unemployment rate among population between the ages 45 and 54 in the United States with a correlation coefficient (R) of 0.053 and weighted average of 4.8%, a difference of 9.8%.
Unemployment Among Ages 45 to 54 years Correlation Summary
| Measurement | Trinidadian and Tobagonian | Delaware |
| Minimum | 1.1% | 1.0% |
| Maximum | 10.2% | 18.1% |
| Range | 9.1% | 17.1% |
| Mean | 5.1% | 6.3% |
| Median | 4.8% | 5.1% |
| Interquartile 25% (IQ1) | 4.1% | 3.9% |
| Interquartile 75% (IQ3) | 6.2% | 8.2% |
| Interquartile Range (IQR) | 2.1% | 4.3% |
| Standard Deviation (Sample) | 1.7% | 3.9% |
| Standard Deviation (Population) | 1.7% | 3.8% |
Similar Demographics by Unemployment Among Ages 45 to 54 years
Demographics Similar to Trinidadians and Tobagonians by Unemployment Among Ages 45 to 54 years
In terms of unemployment among ages 45 to 54 years, the demographic groups most similar to Trinidadians and Tobagonians are Immigrants from Senegal (5.2%, a difference of 0.010%), Immigrants from Portugal (5.2%, a difference of 0.24%), Armenian (5.2%, a difference of 0.24%), Immigrants from Haiti (5.2%, a difference of 0.40%), and Belizean (5.2%, a difference of 0.59%).
| Demographics | Rating | Rank | Unemployment Among Ages 45 to 54 years |
| Iroquois | 0.0 /100 | #285 | Tragic 5.1% |
| Senegalese | 0.0 /100 | #286 | Tragic 5.1% |
| Haitians | 0.0 /100 | #287 | Tragic 5.2% |
| Immigrants | Caribbean | 0.0 /100 | #288 | Tragic 5.2% |
| Immigrants | Haiti | 0.0 /100 | #289 | Tragic 5.2% |
| Immigrants | Portugal | 0.0 /100 | #290 | Tragic 5.2% |
| Armenians | 0.0 /100 | #291 | Tragic 5.2% |
| Trinidadians and Tobagonians | 0.0 /100 | #292 | Tragic 5.2% |
| Immigrants | Senegal | 0.0 /100 | #293 | Tragic 5.2% |
| Belizeans | 0.0 /100 | #294 | Tragic 5.2% |
| Jamaicans | 0.0 /100 | #295 | Tragic 5.3% |
| Aleuts | 0.0 /100 | #296 | Tragic 5.3% |
| West Indians | 0.0 /100 | #297 | Tragic 5.3% |
| Immigrants | Trinidad and Tobago | 0.0 /100 | #298 | Tragic 5.3% |
| Ecuadorians | 0.0 /100 | #299 | Tragic 5.3% |
Demographics Similar to Delaware by Unemployment Among Ages 45 to 54 years
In terms of unemployment among ages 45 to 54 years, the demographic groups most similar to Delaware are Central American (4.8%, a difference of 0.0%), Immigrants from Iraq (4.7%, a difference of 0.070%), Yaqui (4.7%, a difference of 0.10%), Spanish American (4.7%, a difference of 0.10%), and Portuguese (4.8%, a difference of 0.12%).
| Demographics | Rating | Rank | Unemployment Among Ages 45 to 54 years |
| Soviet Union | 2.6 /100 | #234 | Tragic 4.7% |
| Cree | 2.3 /100 | #235 | Tragic 4.7% |
| Tlingit-Haida | 2.3 /100 | #236 | Tragic 4.7% |
| Alsatians | 1.6 /100 | #237 | Tragic 4.7% |
| Yaqui | 1.4 /100 | #238 | Tragic 4.7% |
| Spanish Americans | 1.4 /100 | #239 | Tragic 4.7% |
| Immigrants | Iraq | 1.3 /100 | #240 | Tragic 4.7% |
| Delaware | 1.3 /100 | #241 | Tragic 4.8% |
| Central Americans | 1.3 /100 | #242 | Tragic 4.8% |
| Portuguese | 1.1 /100 | #243 | Tragic 4.8% |
| Seminole | 1.1 /100 | #244 | Tragic 4.8% |
| Immigrants | Albania | 0.9 /100 | #245 | Tragic 4.8% |
| Immigrants | Syria | 0.9 /100 | #246 | Tragic 4.8% |
| Israelis | 0.9 /100 | #247 | Tragic 4.8% |
| Immigrants | Liberia | 0.8 /100 | #248 | Tragic 4.8% |