Peruvian vs Delaware Unemployment Among Ages 45 to 54 years

COMPARE

Peruvian
Race
Ancestry
AfghanAfricanAlaska NativeAlaskan AthabascanAlbanianAleutAlsatianAmericanApacheArabArapahoArgentineanArmenianAssyrian/Chaldean/SyriacAustralianAustrianBahamianBangladeshiBarbadianBasqueBelgianBelizeanBermudanBhutaneseBlackfeetBolivianBrazilianBritishBritish West IndianBulgarianBurmeseCajunCambodianCanadianCape VerdeanCarpatho RusynCelticCentral AmericanCentral American IndianCherokeeCheyenneChickasawChileanChineseChippewaChoctawColombianColvilleComancheCosta RicanCreeCreekCroatianCrowCubanCypriotCzechCzechoslovakianDanishDominicanDutchDutch West IndianEastern EuropeanEcuadorianEgyptianEnglishEstonianEthiopianEuropeanFijianFilipinoFinnishFrenchFrench American IndianFrench CanadianGermanGerman RussianGhanaianGreekGuamanian/ChamorroGuatemalanGuyaneseHaitianHmongHonduranHopiHoumaHungarianIcelanderIndian (Asian)IndonesianInupiatIranianIraqiIrishIroquoisIsraeliItalianJamaicanJapaneseJordanianKenyanKiowaKoreanLaotianLatvianLebaneseLiberianLithuanianLumbeeLuxembourgerMacedonianMalaysianMalteseMarshalleseMenomineeMexicanMexican American IndianMongolianMoroccanNative HawaiianNavajoNepaleseNew ZealanderNicaraguanNigerianNorthern EuropeanNorwegianOkinawanOsageOttawaPaiutePakistaniPalestinianPanamanianParaguayanPennsylvania GermanPeruvianPimaPolishPortuguesePotawatomiPuebloPuerto RicanPuget Sound SalishRomanianRussianSalvadoranSamoanScandinavianScotch-IrishScottishSeminoleSenegaleseSerbianShoshoneSierra LeoneanSiouxSlavicSlovakSloveneSomaliSouth AfricanSouth AmericanSouth American IndianSoviet UnionSpaniardSpanishSpanish AmericanSpanish American IndianSri LankanSubsaharan AfricanSudaneseSwedishSwissSyrianTaiwaneseThaiTlingit-HaidaTohono O'OdhamTonganTrinidadian and TobagonianTsimshianTurkishU.S. Virgin IslanderUgandanUkrainianUruguayanUteVenezuelanVietnameseWelshWest IndianYakamaYaquiYugoslavianYumanYup'ikZimbabwean
Immigration
NonimmigrantsImmigrantsAfghanistanAfricaAlbaniaArgentinaArmeniaAsiaAustraliaAustriaBahamasBangladeshBarbadosBelarusBelgiumBelizeBoliviaBosnia and HerzegovinaBrazilBulgariaBurma/MyanmarCabo VerdeCambodiaCameroonCanadaCaribbeanCentral AmericaChileChinaColombiaCongoCosta RicaCroatiaCubaCzechoslovakiaDenmarkDominicaDominican RepublicEastern AfricaEastern AsiaEastern EuropeEcuadorEgyptEl SalvadorEnglandEritreaEthiopiaEuropeFijiFranceGermanyGhanaGreeceGrenadaGuatemalaGuyanaHaitiHondurasHong KongHungaryIndiaIndonesiaIranIraqIrelandIsraelItalyJamaicaJapanJordanKazakhstanKenyaKoreaKuwaitLaosLatin AmericaLatviaLebanonLiberiaLithuaniaMalaysiaMexicoMicronesiaMiddle AfricaMoldovaMoroccoNepalNetherlandsNicaraguaNigeriaNorth AmericaNorth MacedoniaNorthern AfricaNorthern EuropeNorwayOceaniaPakistanPanamaPeruPhilippinesPolandPortugalRomaniaRussiaSaudi ArabiaScotlandSenegalSerbiaSierra LeoneSingaporeSomaliaSouth AfricaSouth AmericaSouth Central AsiaSouth Eastern AsiaSouthern EuropeSpainSri LankaSt. Vincent and the GrenadinesSudanSwedenSwitzerlandSyriaTaiwanThailandTrinidad and TobagoTurkeyUgandaUkraineUruguayUzbekistanVenezuelaVietnamWest IndiesWestern AfricaWestern AsiaWestern EuropeYemenZaireZimbabweAzores
Delaware
Race
Ancestry
AfghanAfricanAlaska NativeAlaskan AthabascanAlbanianAleutAlsatianAmericanApacheArabArapahoArgentineanArmenianAssyrian/Chaldean/SyriacAustralianAustrianBahamianBangladeshiBarbadianBasqueBelgianBelizeanBermudanBhutaneseBlackfeetBolivianBrazilianBritishBritish West IndianBulgarianBurmeseCajunCambodianCanadianCape VerdeanCarpatho RusynCelticCentral AmericanCentral American IndianCherokeeCheyenneChickasawChileanChineseChippewaChoctawColombianColvilleComancheCosta RicanCreeCreekCroatianCrowCubanCypriotCzechCzechoslovakianDanishDelawareDominicanDutchDutch West IndianEastern EuropeanEcuadorianEgyptianEnglishEstonianEthiopianEuropeanFijianFilipinoFinnishFrenchFrench American IndianFrench CanadianGermanGerman RussianGhanaianGreekGuamanian/ChamorroGuatemalanGuyaneseHaitianHmongHonduranHopiHoumaHungarianIcelanderIndian (Asian)IndonesianInupiatIranianIraqiIrishIroquoisIsraeliItalianJamaicanJapaneseJordanianKenyanKiowaKoreanLaotianLatvianLebaneseLiberianLithuanianLumbeeLuxembourgerMacedonianMalaysianMalteseMarshalleseMenomineeMexicanMexican American IndianMongolianMoroccanNative HawaiianNavajoNepaleseNew ZealanderNicaraguanNigerianNorthern EuropeanNorwegianOkinawanOsageOttawaPaiutePakistaniPalestinianPanamanianParaguayanPennsylvania GermanPimaPolishPortuguesePotawatomiPuebloPuerto RicanPuget Sound SalishRomanianRussianSalvadoranSamoanScandinavianScotch-IrishScottishSeminoleSenegaleseSerbianShoshoneSierra LeoneanSiouxSlavicSlovakSloveneSomaliSouth AfricanSouth AmericanSouth American IndianSoviet UnionSpaniardSpanishSpanish AmericanSpanish American IndianSri LankanSubsaharan AfricanSudaneseSwedishSwissSyrianTaiwaneseThaiTlingit-HaidaTohono O'OdhamTonganTrinidadian and TobagonianTsimshianTurkishU.S. Virgin IslanderUgandanUkrainianUruguayanUteVenezuelanVietnameseWelshWest IndianYakamaYaquiYugoslavianYumanYup'ikZimbabwean
Immigration
NonimmigrantsImmigrantsAfghanistanAfricaAlbaniaArgentinaArmeniaAsiaAustraliaAustriaBahamasBangladeshBarbadosBelarusBelgiumBelizeBoliviaBosnia and HerzegovinaBrazilBulgariaBurma/MyanmarCabo VerdeCambodiaCameroonCanadaCaribbeanCentral AmericaChileChinaColombiaCongoCosta RicaCroatiaCubaCzechoslovakiaDenmarkDominicaDominican RepublicEastern AfricaEastern AsiaEastern EuropeEcuadorEgyptEl SalvadorEnglandEritreaEthiopiaEuropeFijiFranceGermanyGhanaGreeceGrenadaGuatemalaGuyanaHaitiHondurasHong KongHungaryIndiaIndonesiaIranIraqIrelandIsraelItalyJamaicaJapanJordanKazakhstanKenyaKoreaKuwaitLaosLatin AmericaLatviaLebanonLiberiaLithuaniaMalaysiaMexicoMicronesiaMiddle AfricaMoldovaMoroccoNepalNetherlandsNicaraguaNigeriaNorth AmericaNorth MacedoniaNorthern AfricaNorthern EuropeNorwayOceaniaPakistanPanamaPeruPhilippinesPolandPortugalRomaniaRussiaSaudi ArabiaScotlandSenegalSerbiaSierra LeoneSingaporeSomaliaSouth AfricaSouth AmericaSouth Central AsiaSouth Eastern AsiaSouthern EuropeSpainSri LankaSt. Vincent and the GrenadinesSudanSwedenSwitzerlandSyriaTaiwanThailandTrinidad and TobagoTurkeyUgandaUkraineUruguayUzbekistanVenezuelaVietnamWest IndiesWestern AfricaWestern AsiaWestern EuropeYemenZaireZimbabweAzores
Unemployment Among Ages 45 to 54 years
Income
Poverty
Unemployment
Labor Participation
Family Structure
Vehicle Availability
Education Level
Disability

Unemployment Among Ages 45 to 54 years Comparison

Peruvians

Delaware

Fair
Tragic
4.6%
UNEMPLOYMENT AMONG AGES 45 TO 54 YEARS
31.5/ 100
METRIC RATING
195th/ 347
METRIC RANK
4.8%
UNEMPLOYMENT AMONG AGES 45 TO 54 YEARS
1.3/ 100
METRIC RATING
241st/ 347
METRIC RANK

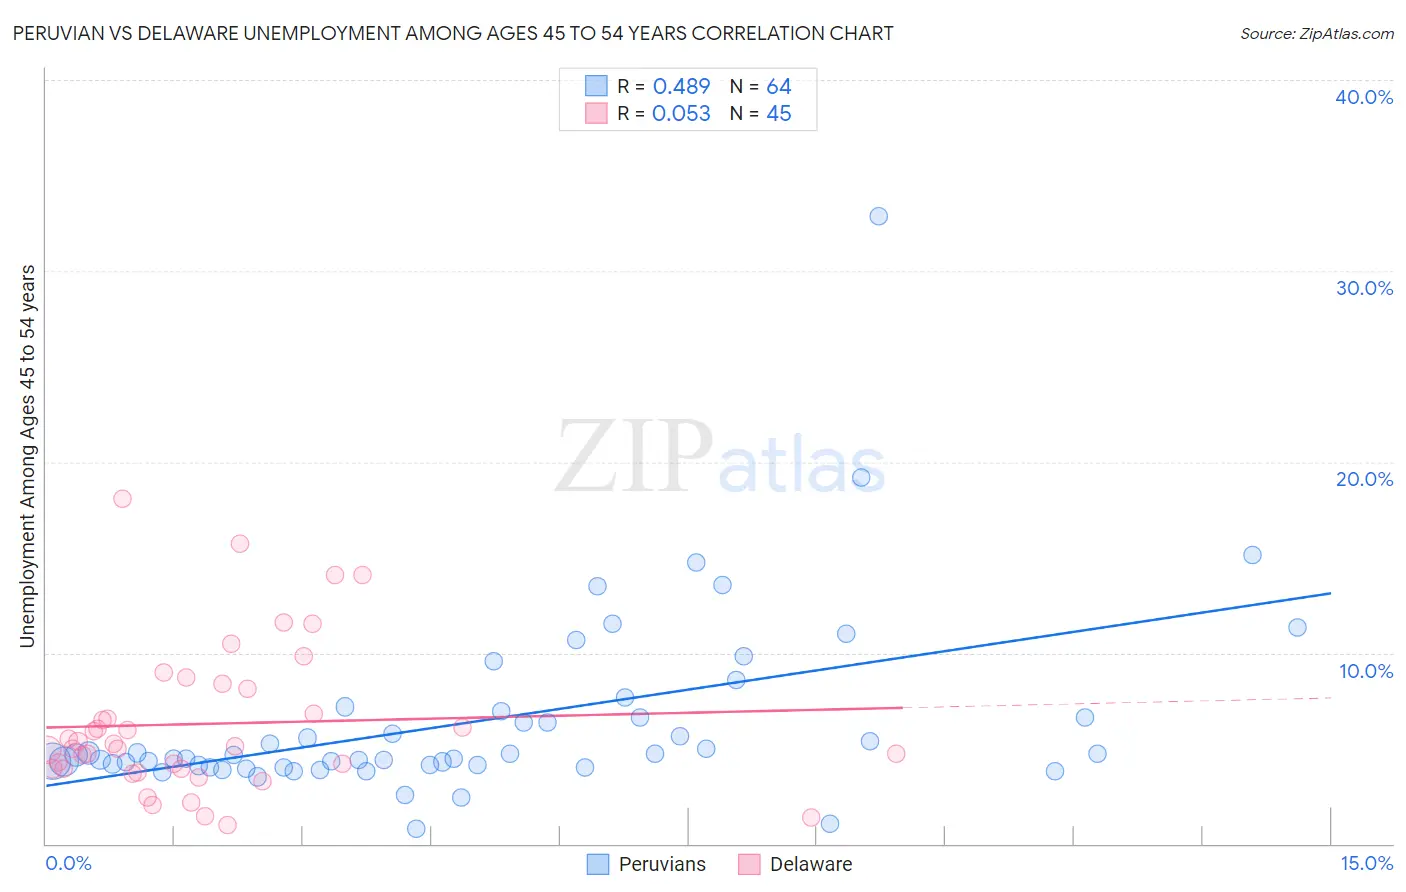
Peruvian vs Delaware Unemployment Among Ages 45 to 54 years Correlation Chart

The statistical analysis conducted on geographies consisting of 356,357,683 people shows a moderate positive correlation between the proportion of Peruvians and unemployment rate among population between the ages 45 and 54 in the United States with a correlation coefficient (R) of 0.489 and weighted average of 4.6%. Similarly, the statistical analysis conducted on geographies consisting of 95,085,648 people shows a slight positive correlation between the proportion of Delaware and unemployment rate among population between the ages 45 and 54 in the United States with a correlation coefficient (R) of 0.053 and weighted average of 4.8%, a difference of 4.2%.
Peruvian vs Delaware Unemployment Among Ages 45 to 54 years

Unemployment Among Ages 45 to 54 years Correlation Summary

MeasurementPeruvianDelaware
Minimum0.82%1.0%
Maximum32.8%18.1%
Range32.0%17.1%
Mean6.4%6.3%
Median4.6%5.1%
Interquartile 25% (IQ1)4.1%3.9%
Interquartile 75% (IQ3)6.8%8.2%
Interquartile Range (IQR)2.7%4.3%
Standard Deviation (Sample)4.9%3.9%
Standard Deviation (Population)4.8%3.8%

Similar Demographics by Unemployment Among Ages 45 to 54 years

Demographics Similar to Peruvians by Unemployment Among Ages 45 to 54 years

In terms of unemployment among ages 45 to 54 years, the demographic groups most similar to Peruvians are Estonian (4.6%, a difference of 0.020%), Albanian (4.6%, a difference of 0.020%), Immigrants from Belarus (4.6%, a difference of 0.050%), South American (4.6%, a difference of 0.070%), and Immigrants from Lithuania (4.6%, a difference of 0.090%).
DemographicsRating | RankUnemployment Among Ages 45 to 54 years
Immigrants | Sierra Leone
36.3
/100
|
#188
Fair
4.6%
Immigrants | Laos
35.7
/100
|
#189
Fair
4.6%
Immigrants | Serbia
34.8
/100
|
#190
Fair
4.6%
Immigrants | Uruguay
34.4
/100
|
#191
Fair
4.6%
Immigrants | Thailand
34.1
/100
|
#192
Fair
4.6%
Immigrants | Lithuania
33.2
/100
|
#193
Fair
4.6%
South Americans
32.9
/100
|
#194
Fair
4.6%
Peruvians
31.5
/100
|
#195
Fair
4.6%
Estonians
31.2
/100
|
#196
Fair
4.6%
Albanians
31.1
/100
|
#197
Fair
4.6%
Immigrants | Belarus
30.6
/100
|
#198
Fair
4.6%
Brazilians
20.1
/100
|
#199
Fair
4.6%
Immigrants | Denmark
19.8
/100
|
#200
Poor
4.6%
Immigrants | Costa Rica
19.7
/100
|
#201
Poor
4.6%
Immigrants | Peru
19.1
/100
|
#202
Poor
4.6%

Demographics Similar to Delaware by Unemployment Among Ages 45 to 54 years

In terms of unemployment among ages 45 to 54 years, the demographic groups most similar to Delaware are Central American (4.8%, a difference of 0.0%), Immigrants from Iraq (4.7%, a difference of 0.070%), Yaqui (4.7%, a difference of 0.10%), Spanish American (4.7%, a difference of 0.10%), and Portuguese (4.8%, a difference of 0.12%).
DemographicsRating | RankUnemployment Among Ages 45 to 54 years
Soviet Union
2.6
/100
|
#234
Tragic
4.7%
Cree
2.3
/100
|
#235
Tragic
4.7%
Tlingit-Haida
2.3
/100
|
#236
Tragic
4.7%
Alsatians
1.6
/100
|
#237
Tragic
4.7%
Yaqui
1.4
/100
|
#238
Tragic
4.7%
Spanish Americans
1.4
/100
|
#239
Tragic
4.7%
Immigrants | Iraq
1.3
/100
|
#240
Tragic
4.7%
Delaware
1.3
/100
|
#241
Tragic
4.8%
Central Americans
1.3
/100
|
#242
Tragic
4.8%
Portuguese
1.1
/100
|
#243
Tragic
4.8%
Seminole
1.1
/100
|
#244
Tragic
4.8%
Immigrants | Albania
0.9
/100
|
#245
Tragic
4.8%
Immigrants | Syria
0.9
/100
|
#246
Tragic
4.8%
Israelis
0.9
/100
|
#247
Tragic
4.8%
Immigrants | Liberia
0.8
/100
|
#248
Tragic
4.8%