Czechoslovakian vs Immigrants from Sweden Unemployment
COMPARE
Czechoslovakian
Immigrants from Sweden
Unemployment
Unemployment Comparison
Czechoslovakians
Immigrants from Sweden
4.8%
UNEMPLOYMENT
99.7/ 100
METRIC RATING
37th/ 347
METRIC RANK
5.0%
UNEMPLOYMENT
97.6/ 100
METRIC RATING
80th/ 347
METRIC RANK
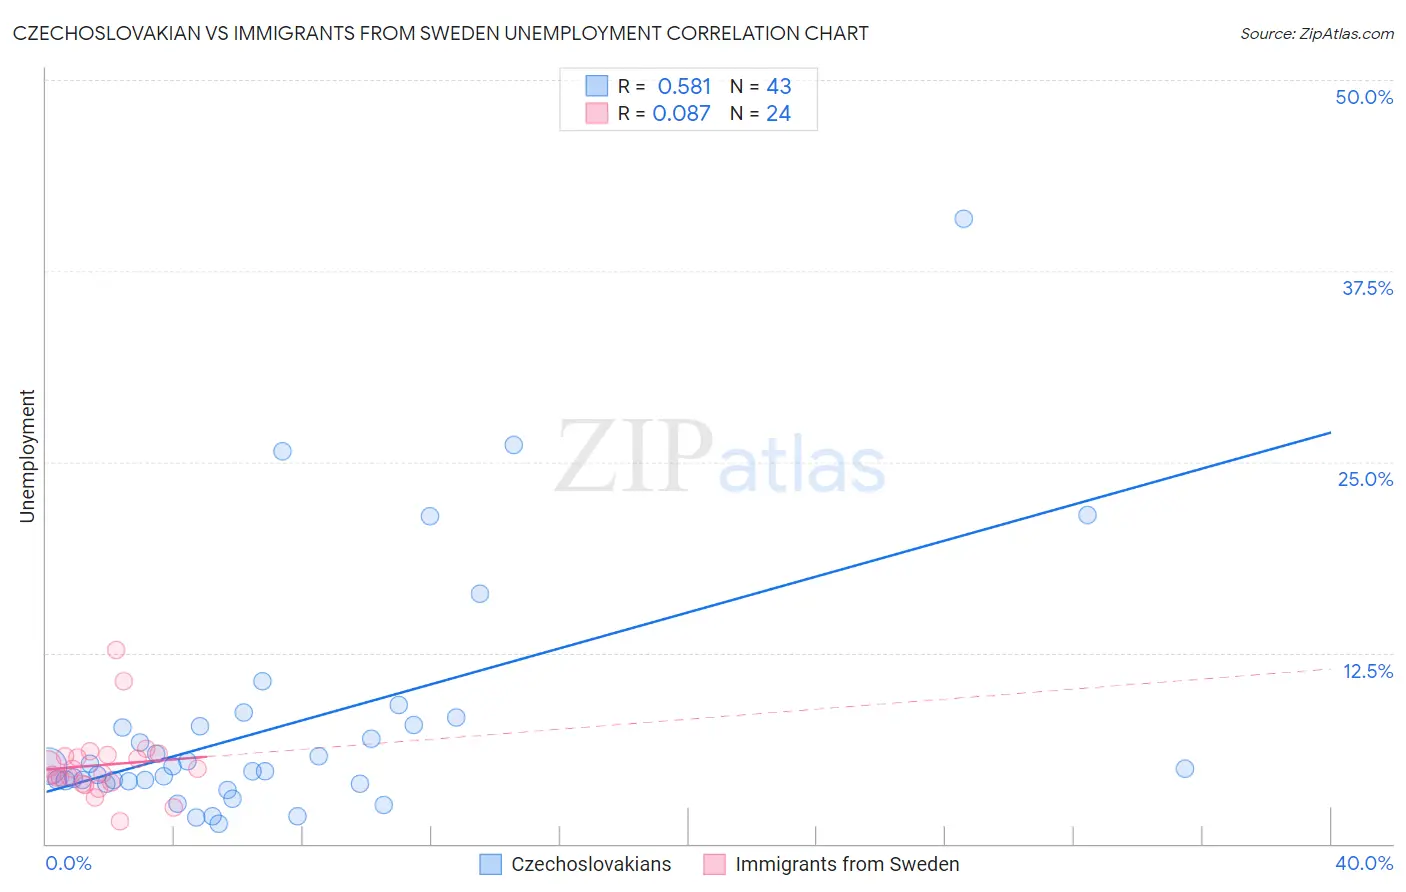
Czechoslovakian vs Immigrants from Sweden Unemployment Correlation Chart
The statistical analysis conducted on geographies consisting of 368,083,136 people shows a substantial positive correlation between the proportion of Czechoslovakians and unemployment in the United States with a correlation coefficient (R) of 0.581 and weighted average of 4.8%. Similarly, the statistical analysis conducted on geographies consisting of 164,697,835 people shows a slight positive correlation between the proportion of Immigrants from Sweden and unemployment in the United States with a correlation coefficient (R) of 0.087 and weighted average of 5.0%, a difference of 3.7%.
Unemployment Correlation Summary
| Measurement | Czechoslovakian | Immigrants from Sweden |
| Minimum | 1.3% | 1.5% |
| Maximum | 40.9% | 12.7% |
| Range | 39.6% | 11.2% |
| Mean | 7.8% | 5.2% |
| Median | 4.9% | 4.7% |
| Interquartile 25% (IQ1) | 4.1% | 4.0% |
| Interquartile 75% (IQ3) | 7.8% | 5.8% |
| Interquartile Range (IQR) | 3.7% | 1.8% |
| Standard Deviation (Sample) | 8.0% | 2.3% |
| Standard Deviation (Population) | 7.9% | 2.3% |
Similar Demographics by Unemployment
Demographics Similar to Czechoslovakians by Unemployment
In terms of unemployment, the demographic groups most similar to Czechoslovakians are Tongan (4.8%, a difference of 0.070%), Bolivian (4.8%, a difference of 0.19%), Scotch-Irish (4.8%, a difference of 0.29%), Lithuanian (4.8%, a difference of 0.34%), and Northern European (4.8%, a difference of 0.35%).
| Demographics | Rating | Rank | Unemployment |
| Irish | 99.8 /100 | #30 | Exceptional 4.8% |
| Croatians | 99.8 /100 | #31 | Exceptional 4.8% |
| Zimbabweans | 99.8 /100 | #32 | Exceptional 4.8% |
| Sudanese | 99.8 /100 | #33 | Exceptional 4.8% |
| Immigrants | Bolivia | 99.8 /100 | #34 | Exceptional 4.8% |
| Scotch-Irish | 99.8 /100 | #35 | Exceptional 4.8% |
| Tongans | 99.7 /100 | #36 | Exceptional 4.8% |
| Czechoslovakians | 99.7 /100 | #37 | Exceptional 4.8% |
| Bolivians | 99.7 /100 | #38 | Exceptional 4.8% |
| Lithuanians | 99.7 /100 | #39 | Exceptional 4.8% |
| Northern Europeans | 99.7 /100 | #40 | Exceptional 4.8% |
| Immigrants | Bosnia and Herzegovina | 99.7 /100 | #41 | Exceptional 4.8% |
| Filipinos | 99.5 /100 | #42 | Exceptional 4.8% |
| Yugoslavians | 99.5 /100 | #43 | Exceptional 4.8% |
| Austrians | 99.5 /100 | #44 | Exceptional 4.8% |
Demographics Similar to Immigrants from Sweden by Unemployment
In terms of unemployment, the demographic groups most similar to Immigrants from Sweden are Basque (5.0%, a difference of 0.010%), Fijian (5.0%, a difference of 0.020%), Hmong (5.0%, a difference of 0.030%), Canadian (5.0%, a difference of 0.070%), and Russian (5.0%, a difference of 0.11%).
| Demographics | Rating | Rank | Unemployment |
| Paraguayans | 98.3 /100 | #73 | Exceptional 4.9% |
| Immigrants | Northern Europe | 98.2 /100 | #74 | Exceptional 4.9% |
| Turks | 98.0 /100 | #75 | Exceptional 4.9% |
| German Russians | 98.0 /100 | #76 | Exceptional 4.9% |
| Cypriots | 97.9 /100 | #77 | Exceptional 4.9% |
| Okinawans | 97.9 /100 | #78 | Exceptional 4.9% |
| Canadians | 97.7 /100 | #79 | Exceptional 5.0% |
| Immigrants | Sweden | 97.6 /100 | #80 | Exceptional 5.0% |
| Basques | 97.6 /100 | #81 | Exceptional 5.0% |
| Fijians | 97.6 /100 | #82 | Exceptional 5.0% |
| Hmong | 97.6 /100 | #83 | Exceptional 5.0% |
| Russians | 97.4 /100 | #84 | Exceptional 5.0% |
| Immigrants | Australia | 97.0 /100 | #85 | Exceptional 5.0% |
| Hungarians | 96.9 /100 | #86 | Exceptional 5.0% |
| Immigrants | Moldova | 96.6 /100 | #87 | Exceptional 5.0% |