Mexican vs French Male Unemployment
COMPARE
Mexican
French
Male Unemployment
Male Unemployment Comparison
Mexicans
French
5.8%
MALE UNEMPLOYMENT
0.2/ 100
METRIC RATING
252nd/ 347
METRIC RANK
5.0%
MALE UNEMPLOYMENT
96.2/ 100
METRIC RATING
81st/ 347
METRIC RANK
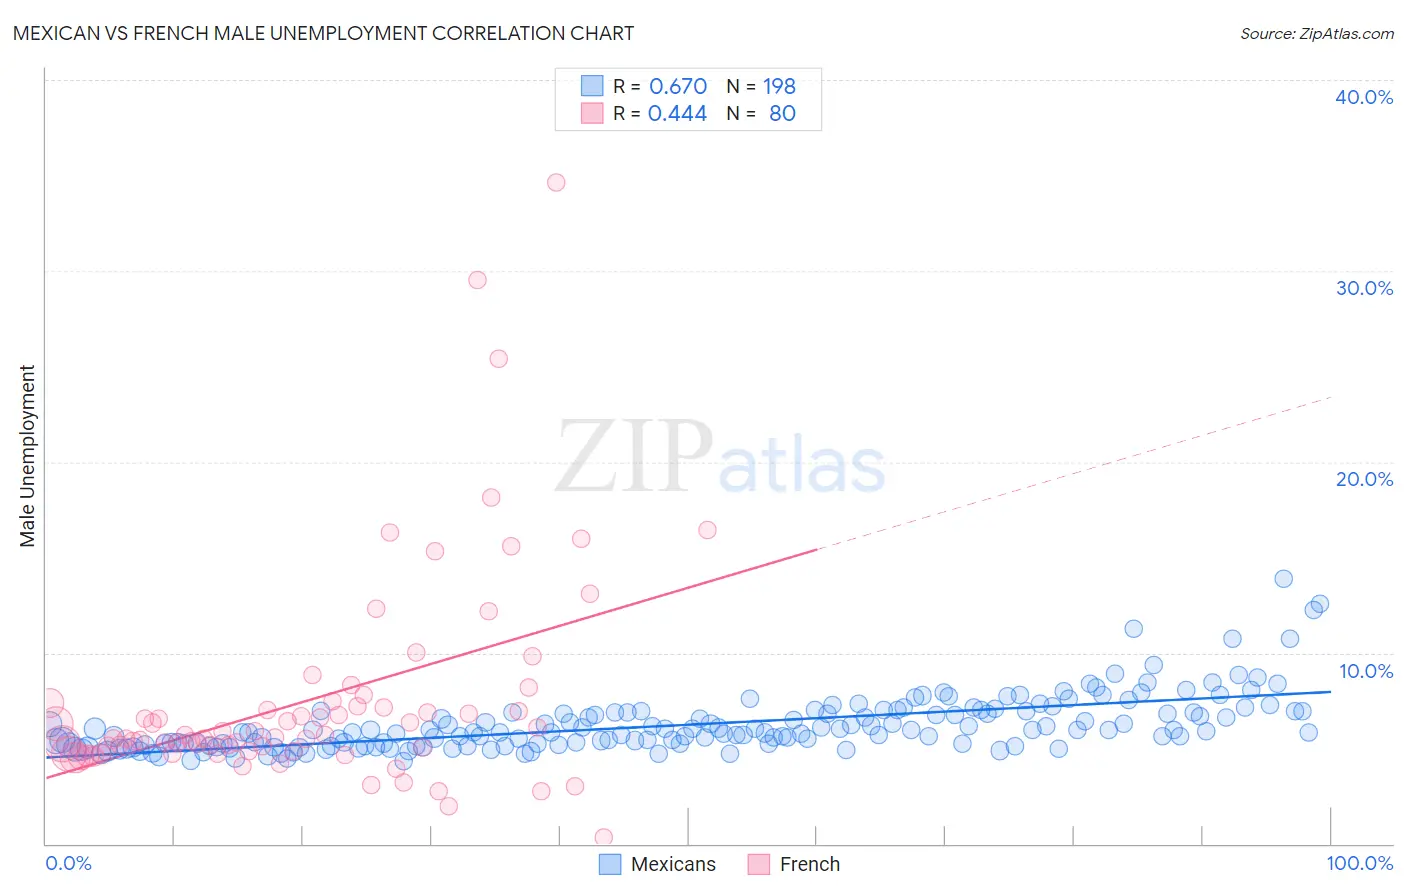
Mexican vs French Male Unemployment Correlation Chart
The statistical analysis conducted on geographies consisting of 555,694,917 people shows a significant positive correlation between the proportion of Mexicans and unemployment rate among males in the United States with a correlation coefficient (R) of 0.670 and weighted average of 5.8%. Similarly, the statistical analysis conducted on geographies consisting of 561,355,143 people shows a moderate positive correlation between the proportion of French and unemployment rate among males in the United States with a correlation coefficient (R) of 0.444 and weighted average of 5.0%, a difference of 14.3%.
Male Unemployment Correlation Summary
| Measurement | Mexican | French |
| Minimum | 4.3% | 0.30% |
| Maximum | 13.9% | 34.6% |
| Range | 9.6% | 34.3% |
| Mean | 6.2% | 7.6% |
| Median | 5.8% | 5.6% |
| Interquartile 25% (IQ1) | 5.2% | 4.9% |
| Interquartile 75% (IQ3) | 6.9% | 7.3% |
| Interquartile Range (IQR) | 1.7% | 2.4% |
| Standard Deviation (Sample) | 1.5% | 5.7% |
| Standard Deviation (Population) | 1.5% | 5.6% |
Similar Demographics by Male Unemployment
Demographics Similar to Mexicans by Male Unemployment
In terms of male unemployment, the demographic groups most similar to Mexicans are Mexican American Indian (5.8%, a difference of 0.13%), Japanese (5.8%, a difference of 0.30%), Kiowa (5.8%, a difference of 0.41%), Comanche (5.8%, a difference of 0.49%), and Spanish American (5.7%, a difference of 0.57%).
| Demographics | Rating | Rank | Male Unemployment |
| Yaqui | 0.7 /100 | #245 | Tragic 5.7% |
| Iroquois | 0.6 /100 | #246 | Tragic 5.7% |
| Hawaiians | 0.6 /100 | #247 | Tragic 5.7% |
| Marshallese | 0.5 /100 | #248 | Tragic 5.7% |
| Cree | 0.4 /100 | #249 | Tragic 5.7% |
| Immigrants | Bahamas | 0.4 /100 | #250 | Tragic 5.7% |
| Spanish Americans | 0.3 /100 | #251 | Tragic 5.7% |
| Mexicans | 0.2 /100 | #252 | Tragic 5.8% |
| Mexican American Indians | 0.2 /100 | #253 | Tragic 5.8% |
| Japanese | 0.2 /100 | #254 | Tragic 5.8% |
| Kiowa | 0.2 /100 | #255 | Tragic 5.8% |
| Comanche | 0.2 /100 | #256 | Tragic 5.8% |
| Hispanics or Latinos | 0.1 /100 | #257 | Tragic 5.8% |
| Dutch West Indians | 0.1 /100 | #258 | Tragic 5.8% |
| Cajuns | 0.1 /100 | #259 | Tragic 5.8% |
Demographics Similar to French by Male Unemployment
In terms of male unemployment, the demographic groups most similar to French are Argentinean (5.0%, a difference of 0.0%), Chilean (5.0%, a difference of 0.030%), South African (5.0%, a difference of 0.050%), Immigrants from Northern Europe (5.0%, a difference of 0.070%), and Iranian (5.0%, a difference of 0.080%).
| Demographics | Rating | Rank | Male Unemployment |
| Immigrants | North America | 96.9 /100 | #74 | Exceptional 5.0% |
| Assyrians/Chaldeans/Syriacs | 96.9 /100 | #75 | Exceptional 5.0% |
| Immigrants | Sudan | 96.5 /100 | #76 | Exceptional 5.0% |
| Iranians | 96.4 /100 | #77 | Exceptional 5.0% |
| Immigrants | Northern Europe | 96.4 /100 | #78 | Exceptional 5.0% |
| South Africans | 96.4 /100 | #79 | Exceptional 5.0% |
| Argentineans | 96.2 /100 | #80 | Exceptional 5.0% |
| French | 96.2 /100 | #81 | Exceptional 5.0% |
| Chileans | 96.2 /100 | #82 | Exceptional 5.0% |
| Immigrants | Eritrea | 96.0 /100 | #83 | Exceptional 5.0% |
| Serbians | 95.7 /100 | #84 | Exceptional 5.1% |
| Immigrants | North Macedonia | 95.6 /100 | #85 | Exceptional 5.1% |
| Maltese | 95.5 /100 | #86 | Exceptional 5.1% |
| Immigrants | Romania | 95.4 /100 | #87 | Exceptional 5.1% |
| Immigrants | Sri Lanka | 94.9 /100 | #88 | Exceptional 5.1% |