Mexican vs Mongolian Female Unemployment
COMPARE
Mexican
Mongolian
Female Unemployment
Female Unemployment Comparison
Mexicans
Mongolians
6.1%
FEMALE UNEMPLOYMENT
0.0/ 100
METRIC RATING
293rd/ 347
METRIC RANK
5.0%
FEMALE UNEMPLOYMENT
97.8/ 100
METRIC RATING
77th/ 347
METRIC RANK
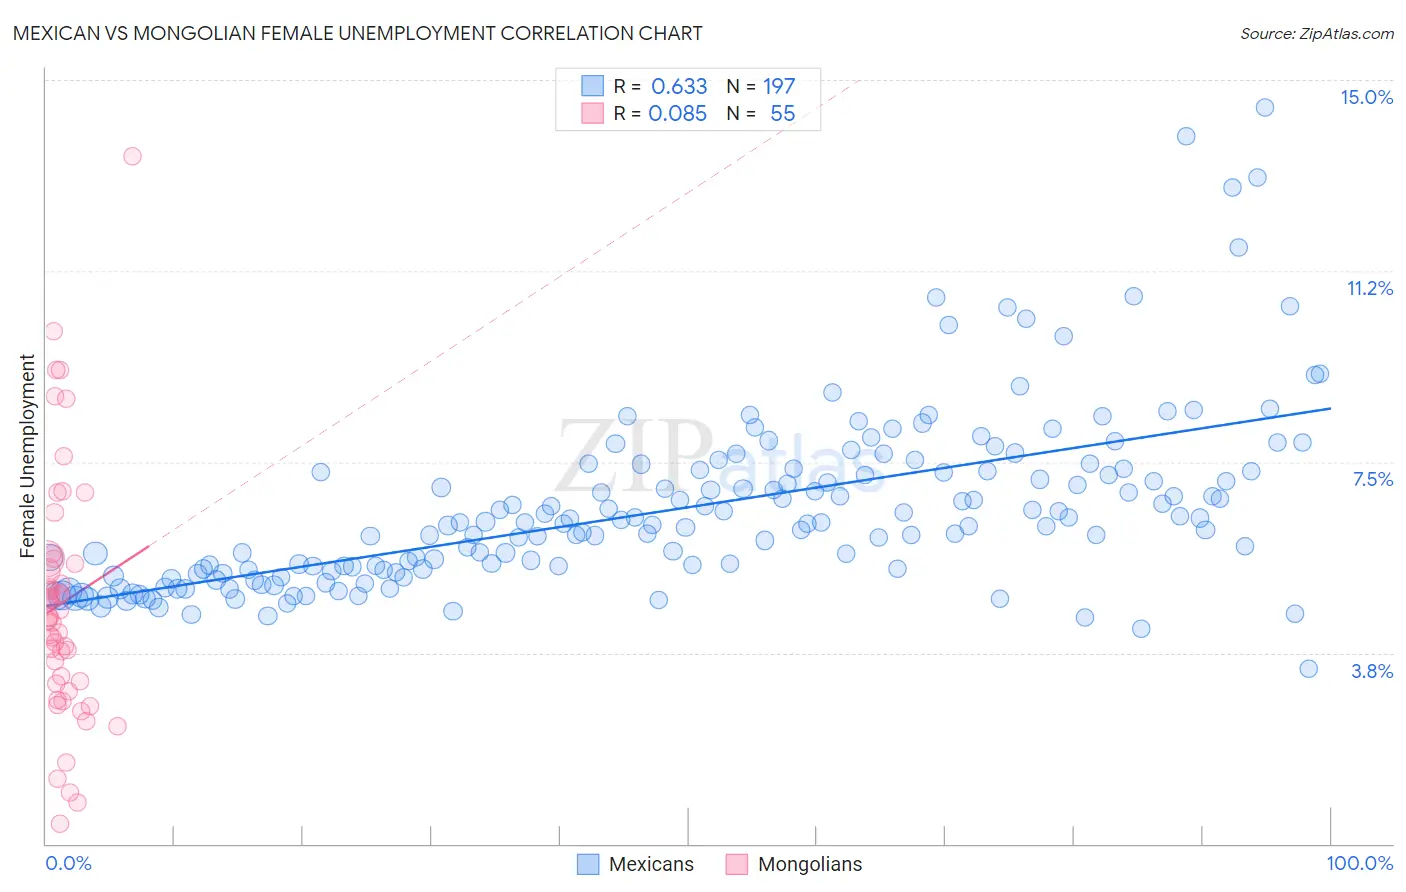
Mexican vs Mongolian Female Unemployment Correlation Chart
The statistical analysis conducted on geographies consisting of 553,339,596 people shows a significant positive correlation between the proportion of Mexicans and unemploymnet rate among females in the United States with a correlation coefficient (R) of 0.633 and weighted average of 6.1%. Similarly, the statistical analysis conducted on geographies consisting of 140,252,025 people shows a slight positive correlation between the proportion of Mongolians and unemploymnet rate among females in the United States with a correlation coefficient (R) of 0.085 and weighted average of 5.0%, a difference of 23.2%.
Female Unemployment Correlation Summary
| Measurement | Mexican | Mongolian |
| Minimum | 3.4% | 0.40% |
| Maximum | 14.5% | 13.5% |
| Range | 11.0% | 13.1% |
| Mean | 6.6% | 4.7% |
| Median | 6.3% | 4.4% |
| Interquartile 25% (IQ1) | 5.4% | 3.1% |
| Interquartile 75% (IQ3) | 7.3% | 5.6% |
| Interquartile Range (IQR) | 1.9% | 2.5% |
| Standard Deviation (Sample) | 1.8% | 2.5% |
| Standard Deviation (Population) | 1.8% | 2.4% |
Similar Demographics by Female Unemployment
Demographics Similar to Mexicans by Female Unemployment
In terms of female unemployment, the demographic groups most similar to Mexicans are Immigrants from Trinidad and Tobago (6.1%, a difference of 0.080%), Immigrants from El Salvador (6.1%, a difference of 0.10%), Immigrants from West Indies (6.1%, a difference of 0.15%), Immigrants from Latin America (6.1%, a difference of 0.20%), and Alaskan Athabascan (6.1%, a difference of 0.22%).
| Demographics | Rating | Rank | Female Unemployment |
| Chippewa | 0.0 /100 | #286 | Tragic 6.1% |
| Immigrants | Guatemala | 0.0 /100 | #287 | Tragic 6.1% |
| Haitians | 0.0 /100 | #288 | Tragic 6.1% |
| Trinidadians and Tobagonians | 0.0 /100 | #289 | Tragic 6.1% |
| Immigrants | Caribbean | 0.0 /100 | #290 | Tragic 6.1% |
| Immigrants | West Indies | 0.0 /100 | #291 | Tragic 6.1% |
| Immigrants | Trinidad and Tobago | 0.0 /100 | #292 | Tragic 6.1% |
| Mexicans | 0.0 /100 | #293 | Tragic 6.1% |
| Immigrants | El Salvador | 0.0 /100 | #294 | Tragic 6.1% |
| Immigrants | Latin America | 0.0 /100 | #295 | Tragic 6.1% |
| Alaskan Athabascans | 0.0 /100 | #296 | Tragic 6.1% |
| West Indians | 0.0 /100 | #297 | Tragic 6.1% |
| Jamaicans | 0.0 /100 | #298 | Tragic 6.1% |
| Ute | 0.0 /100 | #299 | Tragic 6.1% |
| Immigrants | Haiti | 0.0 /100 | #300 | Tragic 6.1% |
Demographics Similar to Mongolians by Female Unemployment
In terms of female unemployment, the demographic groups most similar to Mongolians are Immigrants from Netherlands (5.0%, a difference of 0.0%), Immigrants from Venezuela (5.0%, a difference of 0.090%), Immigrants from Singapore (5.0%, a difference of 0.10%), Immigrants from Bolivia (5.0%, a difference of 0.12%), and Russian (5.0%, a difference of 0.13%).
| Demographics | Rating | Rank | Female Unemployment |
| Osage | 98.2 /100 | #70 | Exceptional 4.9% |
| German Russians | 98.1 /100 | #71 | Exceptional 4.9% |
| Immigrants | Northern Europe | 98.0 /100 | #72 | Exceptional 4.9% |
| Russians | 98.0 /100 | #73 | Exceptional 5.0% |
| Immigrants | Bolivia | 98.0 /100 | #74 | Exceptional 5.0% |
| Immigrants | Singapore | 98.0 /100 | #75 | Exceptional 5.0% |
| Immigrants | Venezuela | 97.9 /100 | #76 | Exceptional 5.0% |
| Mongolians | 97.8 /100 | #77 | Exceptional 5.0% |
| Immigrants | Netherlands | 97.8 /100 | #78 | Exceptional 5.0% |
| Turks | 97.6 /100 | #79 | Exceptional 5.0% |
| New Zealanders | 97.4 /100 | #80 | Exceptional 5.0% |
| Filipinos | 97.3 /100 | #81 | Exceptional 5.0% |
| Immigrants | Australia | 97.3 /100 | #82 | Exceptional 5.0% |
| Immigrants | Serbia | 97.2 /100 | #83 | Exceptional 5.0% |
| Canadians | 97.2 /100 | #84 | Exceptional 5.0% |