Maltese vs Immigrants from Cambodia Family Households with Children
COMPARE
Maltese
Immigrants from Cambodia
Family Households with Children
Family Households with Children Comparison
Maltese
Immigrants from Cambodia
26.7%
FAMILY HOUSEHOLDS WITH CHILDREN
0.9/ 100
METRIC RATING
266th/ 347
METRIC RANK
28.9%
FAMILY HOUSEHOLDS WITH CHILDREN
100.0/ 100
METRIC RATING
53rd/ 347
METRIC RANK
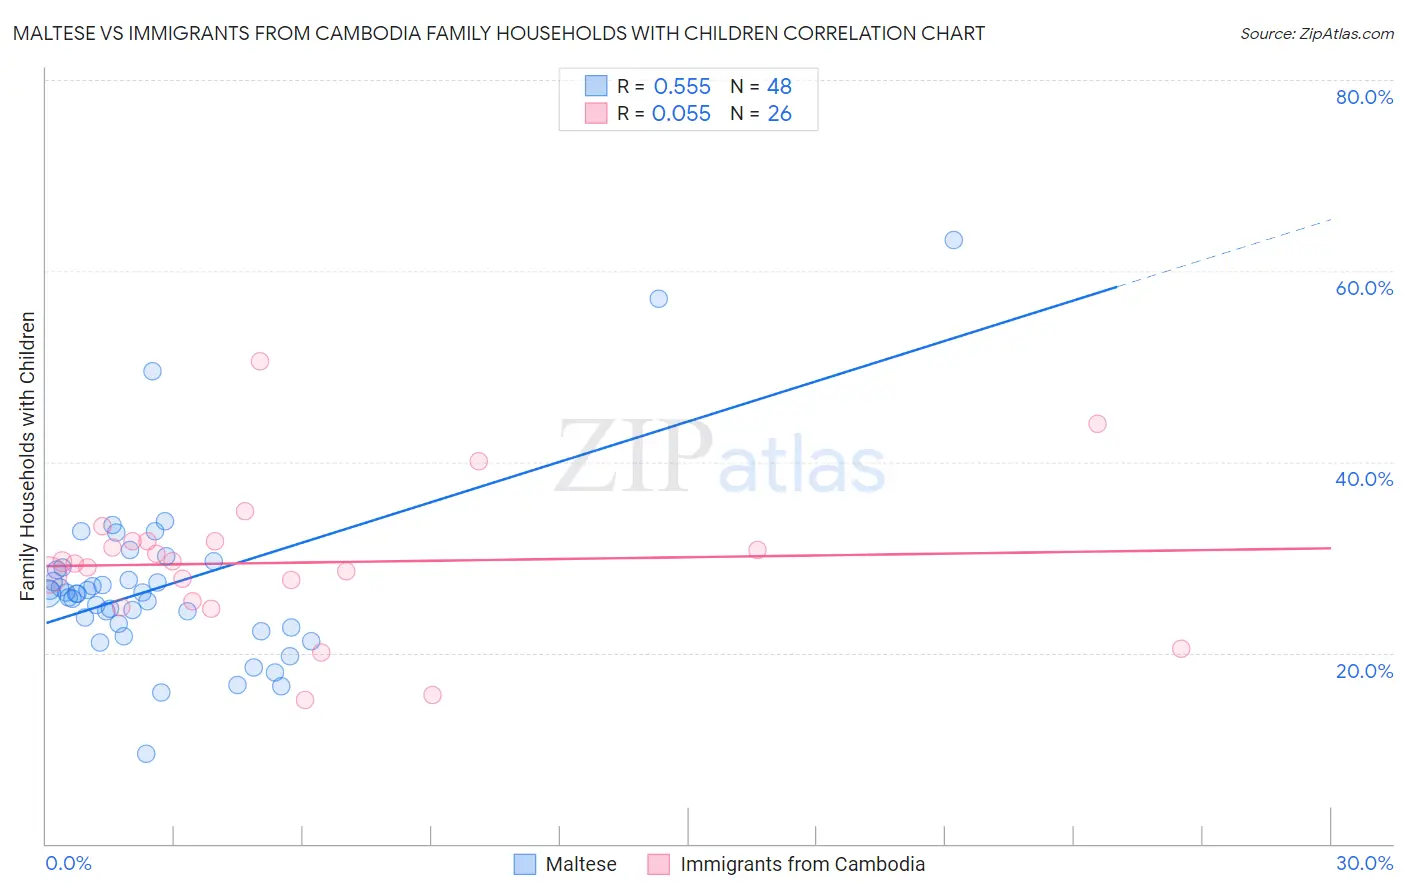
Maltese vs Immigrants from Cambodia Family Households with Children Correlation Chart
The statistical analysis conducted on geographies consisting of 126,400,634 people shows a substantial positive correlation between the proportion of Maltese and percentage of family households with children in the United States with a correlation coefficient (R) of 0.555 and weighted average of 26.7%. Similarly, the statistical analysis conducted on geographies consisting of 205,128,905 people shows a slight positive correlation between the proportion of Immigrants from Cambodia and percentage of family households with children in the United States with a correlation coefficient (R) of 0.055 and weighted average of 28.9%, a difference of 8.0%.
Family Households with Children Correlation Summary
| Measurement | Maltese | Immigrants from Cambodia |
| Minimum | 9.4% | 15.0% |
| Maximum | 63.2% | 50.6% |
| Range | 53.8% | 35.6% |
| Mean | 27.1% | 29.4% |
| Median | 26.2% | 29.5% |
| Interquartile 25% (IQ1) | 22.9% | 25.4% |
| Interquartile 75% (IQ3) | 28.8% | 31.7% |
| Interquartile Range (IQR) | 5.9% | 6.3% |
| Standard Deviation (Sample) | 9.2% | 7.7% |
| Standard Deviation (Population) | 9.1% | 7.5% |
Similar Demographics by Family Households with Children
Demographics Similar to Maltese by Family Households with Children
In terms of family households with children, the demographic groups most similar to Maltese are Immigrants from Uzbekistan (26.7%, a difference of 0.0%), Taiwanese (26.7%, a difference of 0.010%), Chippewa (26.7%, a difference of 0.010%), Immigrants from Belgium (26.7%, a difference of 0.010%), and Immigrants from Russia (26.8%, a difference of 0.050%).
| Demographics | Rating | Rank | Family Households with Children |
| Immigrants | Lithuania | 1.2 /100 | #259 | Tragic 26.8% |
| Immigrants | Jamaica | 1.2 /100 | #260 | Tragic 26.8% |
| Immigrants | Belarus | 1.1 /100 | #261 | Tragic 26.8% |
| Immigrants | Russia | 1.0 /100 | #262 | Tragic 26.8% |
| Immigrants | North Macedonia | 1.0 /100 | #263 | Tragic 26.7% |
| Taiwanese | 0.9 /100 | #264 | Tragic 26.7% |
| Chippewa | 0.9 /100 | #265 | Tragic 26.7% |
| Maltese | 0.9 /100 | #266 | Tragic 26.7% |
| Immigrants | Uzbekistan | 0.9 /100 | #267 | Tragic 26.7% |
| Immigrants | Belgium | 0.9 /100 | #268 | Tragic 26.7% |
| Immigrants | Denmark | 0.8 /100 | #269 | Tragic 26.7% |
| Immigrants | Zaire | 0.7 /100 | #270 | Tragic 26.7% |
| French | 0.7 /100 | #271 | Tragic 26.7% |
| Somalis | 0.7 /100 | #272 | Tragic 26.7% |
| Immigrants | Hungary | 0.6 /100 | #273 | Tragic 26.7% |
Demographics Similar to Immigrants from Cambodia by Family Households with Children
In terms of family households with children, the demographic groups most similar to Immigrants from Cambodia are Guatemalan (28.9%, a difference of 0.070%), Sierra Leonean (28.9%, a difference of 0.080%), Immigrants from Asia (28.8%, a difference of 0.14%), Immigrants from Peru (28.9%, a difference of 0.15%), and Immigrants (28.9%, a difference of 0.19%).
| Demographics | Rating | Rank | Family Households with Children |
| Immigrants | Philippines | 100.0 /100 | #46 | Exceptional 29.0% |
| Peruvians | 100.0 /100 | #47 | Exceptional 29.0% |
| Apache | 100.0 /100 | #48 | Exceptional 29.0% |
| Jordanians | 100.0 /100 | #49 | Exceptional 29.0% |
| Immigrants | Immigrants | 100.0 /100 | #50 | Exceptional 28.9% |
| Immigrants | Peru | 100.0 /100 | #51 | Exceptional 28.9% |
| Guatemalans | 100.0 /100 | #52 | Exceptional 28.9% |
| Immigrants | Cambodia | 100.0 /100 | #53 | Exceptional 28.9% |
| Sierra Leoneans | 100.0 /100 | #54 | Exceptional 28.9% |
| Immigrants | Asia | 100.0 /100 | #55 | Exceptional 28.8% |
| Immigrants | Guatemala | 100.0 /100 | #56 | Exceptional 28.8% |
| Danes | 100.0 /100 | #57 | Exceptional 28.7% |
| Hawaiians | 100.0 /100 | #58 | Exceptional 28.7% |
| Immigrants | Nigeria | 100.0 /100 | #59 | Exceptional 28.6% |
| Hmong | 99.9 /100 | #60 | Exceptional 28.6% |