Macedonian vs Ottawa Female Unemployment
COMPARE
Macedonian
Ottawa
Female Unemployment
Female Unemployment Comparison
Macedonians
Ottawa
5.1%
FEMALE UNEMPLOYMENT
92.4/ 100
METRIC RATING
110th/ 347
METRIC RANK
5.4%
FEMALE UNEMPLOYMENT
11.6/ 100
METRIC RATING
211th/ 347
METRIC RANK
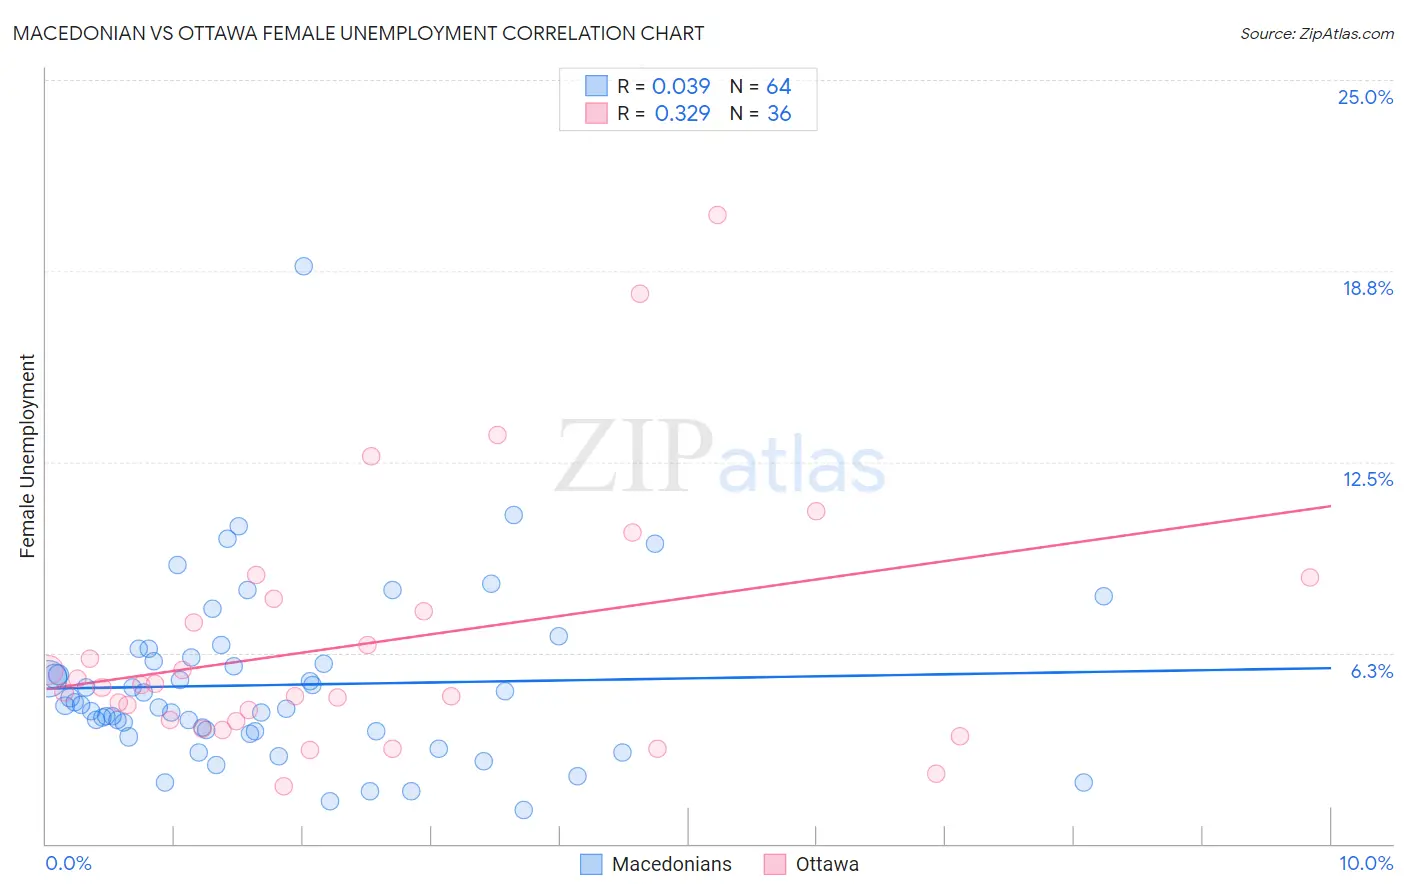
Macedonian vs Ottawa Female Unemployment Correlation Chart
The statistical analysis conducted on geographies consisting of 132,466,796 people shows no correlation between the proportion of Macedonians and unemploymnet rate among females in the United States with a correlation coefficient (R) of 0.039 and weighted average of 5.1%. Similarly, the statistical analysis conducted on geographies consisting of 49,812,692 people shows a mild positive correlation between the proportion of Ottawa and unemploymnet rate among females in the United States with a correlation coefficient (R) of 0.329 and weighted average of 5.4%, a difference of 7.1%.
Female Unemployment Correlation Summary
| Measurement | Macedonian | Ottawa |
| Minimum | 1.1% | 1.9% |
| Maximum | 18.9% | 20.6% |
| Range | 17.8% | 18.7% |
| Mean | 5.2% | 6.6% |
| Median | 4.5% | 5.2% |
| Interquartile 25% (IQ1) | 3.7% | 4.0% |
| Interquartile 75% (IQ3) | 6.0% | 7.8% |
| Interquartile Range (IQR) | 2.3% | 3.8% |
| Standard Deviation (Sample) | 2.8% | 4.2% |
| Standard Deviation (Population) | 2.8% | 4.1% |
Similar Demographics by Female Unemployment
Demographics Similar to Macedonians by Female Unemployment
In terms of female unemployment, the demographic groups most similar to Macedonians are Immigrants from Burma/Myanmar (5.1%, a difference of 0.030%), Estonian (5.1%, a difference of 0.060%), Immigrants from Eastern Africa (5.1%, a difference of 0.10%), Puget Sound Salish (5.1%, a difference of 0.14%), and Immigrants from Switzerland (5.1%, a difference of 0.17%).
| Demographics | Rating | Rank | Female Unemployment |
| Somalis | 94.6 /100 | #103 | Exceptional 5.0% |
| Kenyans | 93.7 /100 | #104 | Exceptional 5.0% |
| Immigrants | England | 93.6 /100 | #105 | Exceptional 5.0% |
| Paraguayans | 93.2 /100 | #106 | Exceptional 5.1% |
| Immigrants | Switzerland | 93.1 /100 | #107 | Exceptional 5.1% |
| Puget Sound Salish | 93.0 /100 | #108 | Exceptional 5.1% |
| Immigrants | Eastern Africa | 92.8 /100 | #109 | Exceptional 5.1% |
| Macedonians | 92.4 /100 | #110 | Exceptional 5.1% |
| Immigrants | Burma/Myanmar | 92.3 /100 | #111 | Exceptional 5.1% |
| Estonians | 92.1 /100 | #112 | Exceptional 5.1% |
| Immigrants | Saudi Arabia | 91.2 /100 | #113 | Exceptional 5.1% |
| Immigrants | Turkey | 91.0 /100 | #114 | Exceptional 5.1% |
| Lebanese | 91.0 /100 | #115 | Exceptional 5.1% |
| Americans | 90.5 /100 | #116 | Exceptional 5.1% |
| Jordanians | 90.3 /100 | #117 | Exceptional 5.1% |
Demographics Similar to Ottawa by Female Unemployment
In terms of female unemployment, the demographic groups most similar to Ottawa are Uruguayan (5.4%, a difference of 0.020%), Choctaw (5.4%, a difference of 0.10%), Samoan (5.4%, a difference of 0.14%), Seminole (5.4%, a difference of 0.19%), and Immigrants from Nicaragua (5.4%, a difference of 0.21%).
| Demographics | Rating | Rank | Female Unemployment |
| Immigrants | Israel | 19.7 /100 | #204 | Poor 5.4% |
| Immigrants | Afghanistan | 18.9 /100 | #205 | Poor 5.4% |
| Immigrants | Brazil | 18.8 /100 | #206 | Poor 5.4% |
| Creek | 15.4 /100 | #207 | Poor 5.4% |
| Immigrants | Costa Rica | 13.7 /100 | #208 | Poor 5.4% |
| Koreans | 13.4 /100 | #209 | Poor 5.4% |
| Choctaw | 12.3 /100 | #210 | Poor 5.4% |
| Ottawa | 11.6 /100 | #211 | Poor 5.4% |
| Uruguayans | 11.4 /100 | #212 | Poor 5.4% |
| Samoans | 10.6 /100 | #213 | Poor 5.4% |
| Seminole | 10.3 /100 | #214 | Poor 5.4% |
| Immigrants | Nicaragua | 10.2 /100 | #215 | Poor 5.4% |
| Comanche | 10.0 /100 | #216 | Poor 5.4% |
| Peruvians | 9.6 /100 | #217 | Tragic 5.4% |
| Bermudans | 9.0 /100 | #218 | Tragic 5.4% |