Immigrants from Caribbean vs Ottawa Female Unemployment
COMPARE
Immigrants from Caribbean
Ottawa
Female Unemployment
Female Unemployment Comparison
Immigrants from Caribbean
Ottawa
6.1%
FEMALE UNEMPLOYMENT
0.0/ 100
METRIC RATING
290th/ 347
METRIC RANK
5.4%
FEMALE UNEMPLOYMENT
11.6/ 100
METRIC RATING
211th/ 347
METRIC RANK
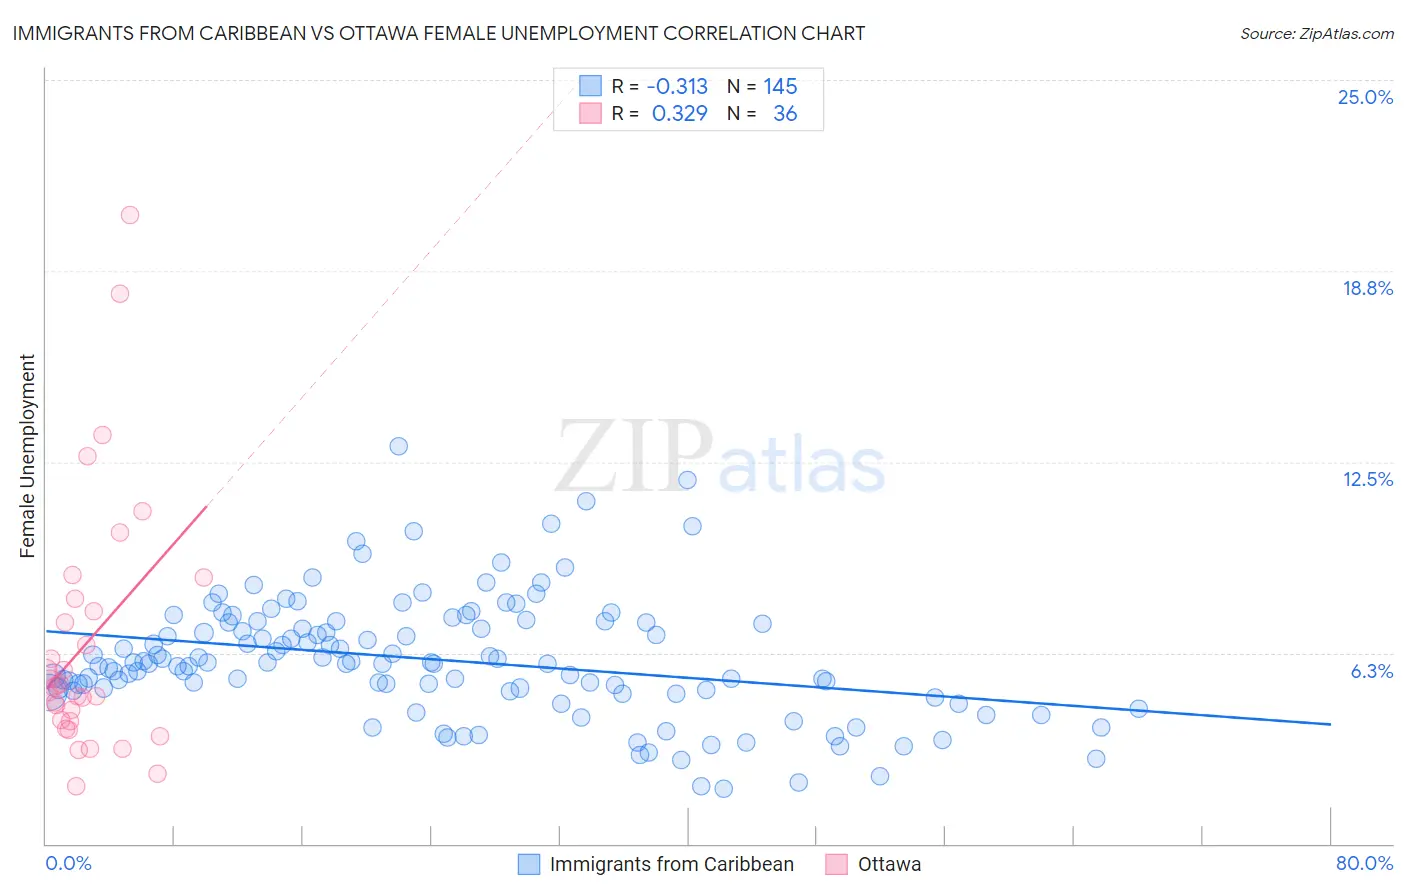
Immigrants from Caribbean vs Ottawa Female Unemployment Correlation Chart
The statistical analysis conducted on geographies consisting of 447,357,611 people shows a mild negative correlation between the proportion of Immigrants from Caribbean and unemploymnet rate among females in the United States with a correlation coefficient (R) of -0.313 and weighted average of 6.1%. Similarly, the statistical analysis conducted on geographies consisting of 49,812,692 people shows a mild positive correlation between the proportion of Ottawa and unemploymnet rate among females in the United States with a correlation coefficient (R) of 0.329 and weighted average of 5.4%, a difference of 12.4%.
Female Unemployment Correlation Summary
| Measurement | Immigrants from Caribbean | Ottawa |
| Minimum | 1.8% | 1.9% |
| Maximum | 13.0% | 20.6% |
| Range | 11.2% | 18.7% |
| Mean | 6.0% | 6.6% |
| Median | 5.9% | 5.2% |
| Interquartile 25% (IQ1) | 5.0% | 4.0% |
| Interquartile 75% (IQ3) | 7.3% | 7.8% |
| Interquartile Range (IQR) | 2.3% | 3.8% |
| Standard Deviation (Sample) | 2.0% | 4.2% |
| Standard Deviation (Population) | 2.0% | 4.1% |
Similar Demographics by Female Unemployment
Demographics Similar to Immigrants from Caribbean by Female Unemployment
In terms of female unemployment, the demographic groups most similar to Immigrants from Caribbean are Trinidadian and Tobagonian (6.1%, a difference of 0.060%), Haitian (6.1%, a difference of 0.070%), Immigrants from Guatemala (6.1%, a difference of 0.11%), Immigrants from West Indies (6.1%, a difference of 0.11%), and Chippewa (6.1%, a difference of 0.14%).
| Demographics | Rating | Rank | Female Unemployment |
| Salvadorans | 0.0 /100 | #283 | Tragic 6.0% |
| Immigrants | Senegal | 0.0 /100 | #284 | Tragic 6.1% |
| Immigrants | Cabo Verde | 0.0 /100 | #285 | Tragic 6.1% |
| Chippewa | 0.0 /100 | #286 | Tragic 6.1% |
| Immigrants | Guatemala | 0.0 /100 | #287 | Tragic 6.1% |
| Haitians | 0.0 /100 | #288 | Tragic 6.1% |
| Trinidadians and Tobagonians | 0.0 /100 | #289 | Tragic 6.1% |
| Immigrants | Caribbean | 0.0 /100 | #290 | Tragic 6.1% |
| Immigrants | West Indies | 0.0 /100 | #291 | Tragic 6.1% |
| Immigrants | Trinidad and Tobago | 0.0 /100 | #292 | Tragic 6.1% |
| Mexicans | 0.0 /100 | #293 | Tragic 6.1% |
| Immigrants | El Salvador | 0.0 /100 | #294 | Tragic 6.1% |
| Immigrants | Latin America | 0.0 /100 | #295 | Tragic 6.1% |
| Alaskan Athabascans | 0.0 /100 | #296 | Tragic 6.1% |
| West Indians | 0.0 /100 | #297 | Tragic 6.1% |
Demographics Similar to Ottawa by Female Unemployment
In terms of female unemployment, the demographic groups most similar to Ottawa are Uruguayan (5.4%, a difference of 0.020%), Choctaw (5.4%, a difference of 0.10%), Samoan (5.4%, a difference of 0.14%), Seminole (5.4%, a difference of 0.19%), and Immigrants from Nicaragua (5.4%, a difference of 0.21%).
| Demographics | Rating | Rank | Female Unemployment |
| Immigrants | Israel | 19.7 /100 | #204 | Poor 5.4% |
| Immigrants | Afghanistan | 18.9 /100 | #205 | Poor 5.4% |
| Immigrants | Brazil | 18.8 /100 | #206 | Poor 5.4% |
| Creek | 15.4 /100 | #207 | Poor 5.4% |
| Immigrants | Costa Rica | 13.7 /100 | #208 | Poor 5.4% |
| Koreans | 13.4 /100 | #209 | Poor 5.4% |
| Choctaw | 12.3 /100 | #210 | Poor 5.4% |
| Ottawa | 11.6 /100 | #211 | Poor 5.4% |
| Uruguayans | 11.4 /100 | #212 | Poor 5.4% |
| Samoans | 10.6 /100 | #213 | Poor 5.4% |
| Seminole | 10.3 /100 | #214 | Poor 5.4% |
| Immigrants | Nicaragua | 10.2 /100 | #215 | Poor 5.4% |
| Comanche | 10.0 /100 | #216 | Poor 5.4% |
| Peruvians | 9.6 /100 | #217 | Tragic 5.4% |
| Bermudans | 9.0 /100 | #218 | Tragic 5.4% |