Macedonian vs Argentinean Female Unemployment
COMPARE
Macedonian
Argentinean
Female Unemployment
Female Unemployment Comparison
Macedonians
Argentineans
5.1%
FEMALE UNEMPLOYMENT
92.4/ 100
METRIC RATING
110th/ 347
METRIC RANK
5.2%
FEMALE UNEMPLOYMENT
79.2/ 100
METRIC RATING
147th/ 347
METRIC RANK
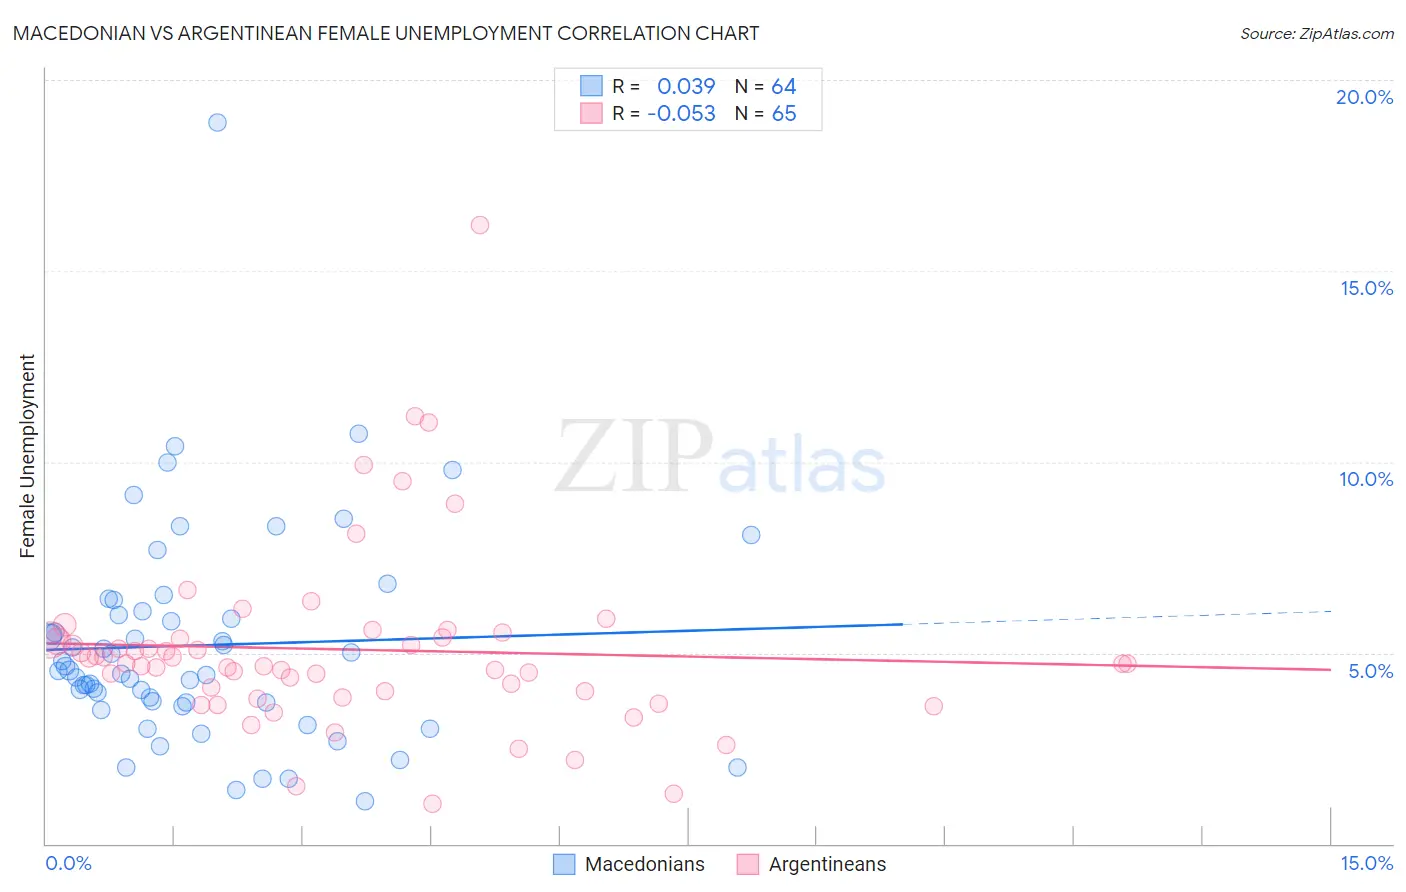
Macedonian vs Argentinean Female Unemployment Correlation Chart
The statistical analysis conducted on geographies consisting of 132,466,796 people shows no correlation between the proportion of Macedonians and unemploymnet rate among females in the United States with a correlation coefficient (R) of 0.039 and weighted average of 5.1%. Similarly, the statistical analysis conducted on geographies consisting of 296,580,968 people shows a slight negative correlation between the proportion of Argentineans and unemploymnet rate among females in the United States with a correlation coefficient (R) of -0.053 and weighted average of 5.2%, a difference of 1.8%.
Female Unemployment Correlation Summary
| Measurement | Macedonian | Argentinean |
| Minimum | 1.1% | 1.0% |
| Maximum | 18.9% | 16.2% |
| Range | 17.8% | 15.2% |
| Mean | 5.2% | 5.1% |
| Median | 4.5% | 4.7% |
| Interquartile 25% (IQ1) | 3.7% | 3.9% |
| Interquartile 75% (IQ3) | 6.0% | 5.4% |
| Interquartile Range (IQR) | 2.3% | 1.5% |
| Standard Deviation (Sample) | 2.8% | 2.4% |
| Standard Deviation (Population) | 2.8% | 2.4% |
Similar Demographics by Female Unemployment
Demographics Similar to Macedonians by Female Unemployment
In terms of female unemployment, the demographic groups most similar to Macedonians are Immigrants from Burma/Myanmar (5.1%, a difference of 0.030%), Estonian (5.1%, a difference of 0.060%), Immigrants from Eastern Africa (5.1%, a difference of 0.10%), Puget Sound Salish (5.1%, a difference of 0.14%), and Immigrants from Switzerland (5.1%, a difference of 0.17%).
| Demographics | Rating | Rank | Female Unemployment |
| Somalis | 94.6 /100 | #103 | Exceptional 5.0% |
| Kenyans | 93.7 /100 | #104 | Exceptional 5.0% |
| Immigrants | England | 93.6 /100 | #105 | Exceptional 5.0% |
| Paraguayans | 93.2 /100 | #106 | Exceptional 5.1% |
| Immigrants | Switzerland | 93.1 /100 | #107 | Exceptional 5.1% |
| Puget Sound Salish | 93.0 /100 | #108 | Exceptional 5.1% |
| Immigrants | Eastern Africa | 92.8 /100 | #109 | Exceptional 5.1% |
| Macedonians | 92.4 /100 | #110 | Exceptional 5.1% |
| Immigrants | Burma/Myanmar | 92.3 /100 | #111 | Exceptional 5.1% |
| Estonians | 92.1 /100 | #112 | Exceptional 5.1% |
| Immigrants | Saudi Arabia | 91.2 /100 | #113 | Exceptional 5.1% |
| Immigrants | Turkey | 91.0 /100 | #114 | Exceptional 5.1% |
| Lebanese | 91.0 /100 | #115 | Exceptional 5.1% |
| Americans | 90.5 /100 | #116 | Exceptional 5.1% |
| Jordanians | 90.3 /100 | #117 | Exceptional 5.1% |
Demographics Similar to Argentineans by Female Unemployment
In terms of female unemployment, the demographic groups most similar to Argentineans are Immigrants from Norway (5.2%, a difference of 0.020%), Immigrants from Oceania (5.2%, a difference of 0.030%), Immigrants from Argentina (5.2%, a difference of 0.050%), Asian (5.2%, a difference of 0.080%), and Egyptian (5.2%, a difference of 0.080%).
| Demographics | Rating | Rank | Female Unemployment |
| Immigrants | France | 82.7 /100 | #140 | Excellent 5.1% |
| Immigrants | Eastern Europe | 81.5 /100 | #141 | Excellent 5.1% |
| Palestinians | 80.8 /100 | #142 | Excellent 5.1% |
| Immigrants | Kazakhstan | 80.7 /100 | #143 | Excellent 5.1% |
| Immigrants | Jordan | 80.4 /100 | #144 | Excellent 5.1% |
| Immigrants | Oceania | 79.5 /100 | #145 | Good 5.2% |
| Immigrants | Norway | 79.4 /100 | #146 | Good 5.2% |
| Argentineans | 79.2 /100 | #147 | Good 5.2% |
| Immigrants | Argentina | 78.7 /100 | #148 | Good 5.2% |
| Asians | 78.3 /100 | #149 | Good 5.2% |
| Egyptians | 78.3 /100 | #150 | Good 5.2% |
| Immigrants | China | 75.9 /100 | #151 | Good 5.2% |
| Immigrants | Italy | 75.0 /100 | #152 | Good 5.2% |
| Immigrants | Greece | 74.9 /100 | #153 | Good 5.2% |
| South Africans | 70.8 /100 | #154 | Good 5.2% |