Alsatian vs Immigrants from Uruguay Female Unemployment
COMPARE
Alsatian
Immigrants from Uruguay
Female Unemployment
Female Unemployment Comparison
Alsatians
Immigrants from Uruguay
5.3%
FEMALE UNEMPLOYMENT
23.9/ 100
METRIC RATING
197th/ 347
METRIC RANK
5.5%
FEMALE UNEMPLOYMENT
4.7/ 100
METRIC RATING
230th/ 347
METRIC RANK
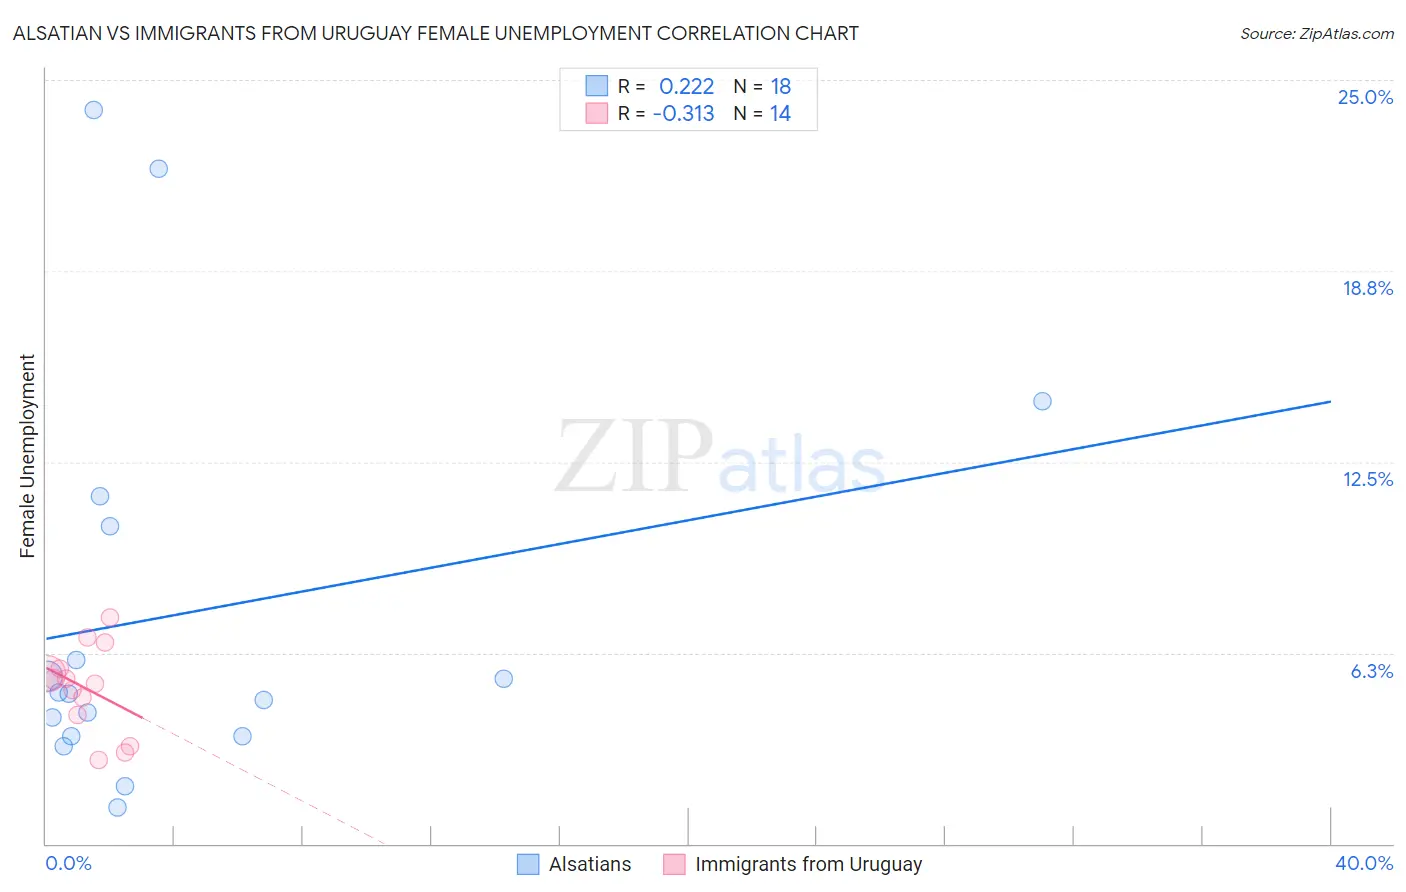
Alsatian vs Immigrants from Uruguay Female Unemployment Correlation Chart
The statistical analysis conducted on geographies consisting of 82,574,814 people shows a weak positive correlation between the proportion of Alsatians and unemploymnet rate among females in the United States with a correlation coefficient (R) of 0.222 and weighted average of 5.3%. Similarly, the statistical analysis conducted on geographies consisting of 133,202,140 people shows a mild negative correlation between the proportion of Immigrants from Uruguay and unemploymnet rate among females in the United States with a correlation coefficient (R) of -0.313 and weighted average of 5.5%, a difference of 2.7%.
Female Unemployment Correlation Summary
| Measurement | Alsatian | Immigrants from Uruguay |
| Minimum | 1.2% | 2.8% |
| Maximum | 24.0% | 7.4% |
| Range | 22.8% | 4.6% |
| Mean | 7.5% | 5.1% |
| Median | 4.9% | 5.3% |
| Interquartile 25% (IQ1) | 3.5% | 4.2% |
| Interquartile 75% (IQ3) | 10.4% | 5.7% |
| Interquartile Range (IQR) | 6.9% | 1.5% |
| Standard Deviation (Sample) | 6.6% | 1.4% |
| Standard Deviation (Population) | 6.4% | 1.3% |
Similar Demographics by Female Unemployment
Demographics Similar to Alsatians by Female Unemployment
In terms of female unemployment, the demographic groups most similar to Alsatians are Tsimshian (5.4%, a difference of 0.070%), Spaniard (5.3%, a difference of 0.10%), Hawaiian (5.4%, a difference of 0.14%), Immigrants from Colombia (5.3%, a difference of 0.18%), and Soviet Union (5.4%, a difference of 0.19%).
| Demographics | Rating | Rank | Female Unemployment |
| Ugandans | 31.2 /100 | #190 | Fair 5.3% |
| Cherokee | 30.8 /100 | #191 | Fair 5.3% |
| Portuguese | 28.6 /100 | #192 | Fair 5.3% |
| Arabs | 27.7 /100 | #193 | Fair 5.3% |
| Colombians | 27.0 /100 | #194 | Fair 5.3% |
| Immigrants | Colombia | 26.2 /100 | #195 | Fair 5.3% |
| Spaniards | 25.2 /100 | #196 | Fair 5.3% |
| Alsatians | 23.9 /100 | #197 | Fair 5.3% |
| Tsimshian | 23.1 /100 | #198 | Fair 5.4% |
| Hawaiians | 22.2 /100 | #199 | Fair 5.4% |
| Soviet Union | 21.7 /100 | #200 | Fair 5.4% |
| Immigrants | Middle Africa | 20.8 /100 | #201 | Fair 5.4% |
| Iroquois | 20.8 /100 | #202 | Fair 5.4% |
| Immigrants | South Eastern Asia | 20.3 /100 | #203 | Fair 5.4% |
| Immigrants | Israel | 19.7 /100 | #204 | Poor 5.4% |
Demographics Similar to Immigrants from Uruguay by Female Unemployment
In terms of female unemployment, the demographic groups most similar to Immigrants from Uruguay are Panamanian (5.5%, a difference of 0.010%), Israeli (5.5%, a difference of 0.020%), Immigrants from Philippines (5.5%, a difference of 0.18%), Immigrants from Iraq (5.5%, a difference of 0.27%), and Liberian (5.5%, a difference of 0.28%).
| Demographics | Rating | Rank | Female Unemployment |
| Delaware | 7.2 /100 | #223 | Tragic 5.5% |
| Iraqis | 7.1 /100 | #224 | Tragic 5.5% |
| French American Indians | 6.1 /100 | #225 | Tragic 5.5% |
| Immigrants | Peru | 5.9 /100 | #226 | Tragic 5.5% |
| Immigrants | Philippines | 5.3 /100 | #227 | Tragic 5.5% |
| Israelis | 4.8 /100 | #228 | Tragic 5.5% |
| Panamanians | 4.7 /100 | #229 | Tragic 5.5% |
| Immigrants | Uruguay | 4.7 /100 | #230 | Tragic 5.5% |
| Immigrants | Iraq | 3.9 /100 | #231 | Tragic 5.5% |
| Liberians | 3.9 /100 | #232 | Tragic 5.5% |
| Moroccans | 3.4 /100 | #233 | Tragic 5.5% |
| Immigrants | Lebanon | 3.3 /100 | #234 | Tragic 5.5% |
| Immigrants | Iran | 3.3 /100 | #235 | Tragic 5.5% |
| Immigrants | Cambodia | 3.3 /100 | #236 | Tragic 5.5% |
| Immigrants | Panama | 3.2 /100 | #237 | Tragic 5.5% |