Lumbee vs Immigrants from Sri Lanka Unemployment
COMPARE
Lumbee
Immigrants from Sri Lanka
Unemployment
Unemployment Comparison
Lumbee
Immigrants from Sri Lanka
6.4%
UNEMPLOYMENT
0.0/ 100
METRIC RATING
306th/ 347
METRIC RANK
5.1%
UNEMPLOYMENT
91.1/ 100
METRIC RATING
116th/ 347
METRIC RANK
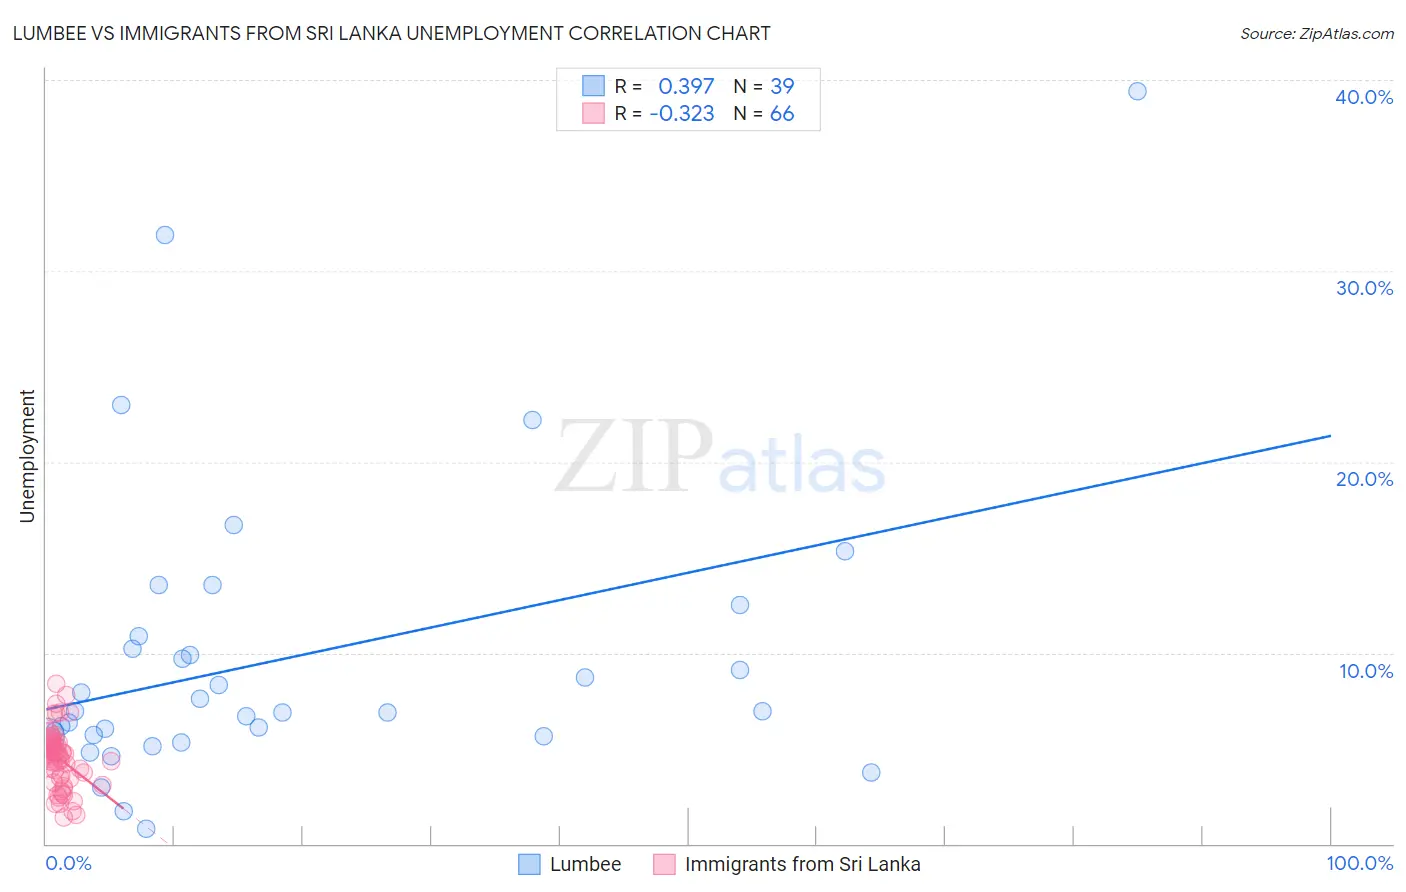
Lumbee vs Immigrants from Sri Lanka Unemployment Correlation Chart
The statistical analysis conducted on geographies consisting of 92,248,032 people shows a mild positive correlation between the proportion of Lumbee and unemployment in the United States with a correlation coefficient (R) of 0.397 and weighted average of 6.4%. Similarly, the statistical analysis conducted on geographies consisting of 149,679,955 people shows a mild negative correlation between the proportion of Immigrants from Sri Lanka and unemployment in the United States with a correlation coefficient (R) of -0.323 and weighted average of 5.1%, a difference of 27.0%.
Unemployment Correlation Summary
| Measurement | Lumbee | Immigrants from Sri Lanka |
| Minimum | 0.80% | 1.4% |
| Maximum | 39.4% | 8.4% |
| Range | 38.6% | 7.0% |
| Mean | 9.8% | 4.5% |
| Median | 6.9% | 4.7% |
| Interquartile 25% (IQ1) | 5.6% | 3.5% |
| Interquartile 75% (IQ3) | 10.9% | 5.2% |
| Interquartile Range (IQR) | 5.2% | 1.8% |
| Standard Deviation (Sample) | 7.8% | 1.5% |
| Standard Deviation (Population) | 7.7% | 1.5% |
Similar Demographics by Unemployment
Demographics Similar to Lumbee by Unemployment
In terms of unemployment, the demographic groups most similar to Lumbee are Menominee (6.4%, a difference of 0.030%), Immigrants from Jamaica (6.4%, a difference of 0.29%), Immigrants from Bangladesh (6.5%, a difference of 0.48%), Barbadian (6.5%, a difference of 0.86%), and Vietnamese (6.5%, a difference of 0.87%).
| Demographics | Rating | Rank | Unemployment |
| Immigrants | West Indies | 0.0 /100 | #299 | Tragic 6.3% |
| Immigrants | Trinidad and Tobago | 0.0 /100 | #300 | Tragic 6.3% |
| Trinidadians and Tobagonians | 0.0 /100 | #301 | Tragic 6.3% |
| West Indians | 0.0 /100 | #302 | Tragic 6.4% |
| Belizeans | 0.0 /100 | #303 | Tragic 6.4% |
| Immigrants | Jamaica | 0.0 /100 | #304 | Tragic 6.4% |
| Menominee | 0.0 /100 | #305 | Tragic 6.4% |
| Lumbee | 0.0 /100 | #306 | Tragic 6.4% |
| Immigrants | Bangladesh | 0.0 /100 | #307 | Tragic 6.5% |
| Barbadians | 0.0 /100 | #308 | Tragic 6.5% |
| Vietnamese | 0.0 /100 | #309 | Tragic 6.5% |
| Immigrants | Belize | 0.0 /100 | #310 | Tragic 6.5% |
| Cape Verdeans | 0.0 /100 | #311 | Tragic 6.5% |
| Colville | 0.0 /100 | #312 | Tragic 6.6% |
| Immigrants | Barbados | 0.0 /100 | #313 | Tragic 6.6% |
Demographics Similar to Immigrants from Sri Lanka by Unemployment
In terms of unemployment, the demographic groups most similar to Immigrants from Sri Lanka are Immigrants from Western Europe (5.1%, a difference of 0.010%), Immigrants from Malaysia (5.1%, a difference of 0.020%), Immigrants from Germany (5.1%, a difference of 0.050%), Immigrants from Ireland (5.1%, a difference of 0.22%), and Immigrants from France (5.1%, a difference of 0.26%).
| Demographics | Rating | Rank | Unemployment |
| Immigrants | Eritrea | 93.3 /100 | #109 | Exceptional 5.0% |
| Immigrants | Lithuania | 93.2 /100 | #110 | Exceptional 5.0% |
| Chileans | 93.2 /100 | #111 | Exceptional 5.0% |
| South Africans | 92.6 /100 | #112 | Exceptional 5.1% |
| Argentineans | 92.4 /100 | #113 | Exceptional 5.1% |
| Immigrants | Ireland | 92.1 /100 | #114 | Exceptional 5.1% |
| Immigrants | Western Europe | 91.1 /100 | #115 | Exceptional 5.1% |
| Immigrants | Sri Lanka | 91.1 /100 | #116 | Exceptional 5.1% |
| Immigrants | Malaysia | 91.0 /100 | #117 | Exceptional 5.1% |
| Immigrants | Germany | 90.8 /100 | #118 | Exceptional 5.1% |
| Immigrants | France | 89.7 /100 | #119 | Excellent 5.1% |
| Macedonians | 89.7 /100 | #120 | Excellent 5.1% |
| Lebanese | 89.2 /100 | #121 | Excellent 5.1% |
| Immigrants | Switzerland | 89.1 /100 | #122 | Excellent 5.1% |
| Asians | 89.0 /100 | #123 | Excellent 5.1% |