Lumbee vs Ugandan Male Unemployment
COMPARE
Lumbee
Ugandan
Male Unemployment
Male Unemployment Comparison
Lumbee
Ugandans
6.9%
MALE UNEMPLOYMENT
0.0/ 100
METRIC RATING
312th/ 347
METRIC RANK
5.5%
MALE UNEMPLOYMENT
6.3/ 100
METRIC RATING
213th/ 347
METRIC RANK
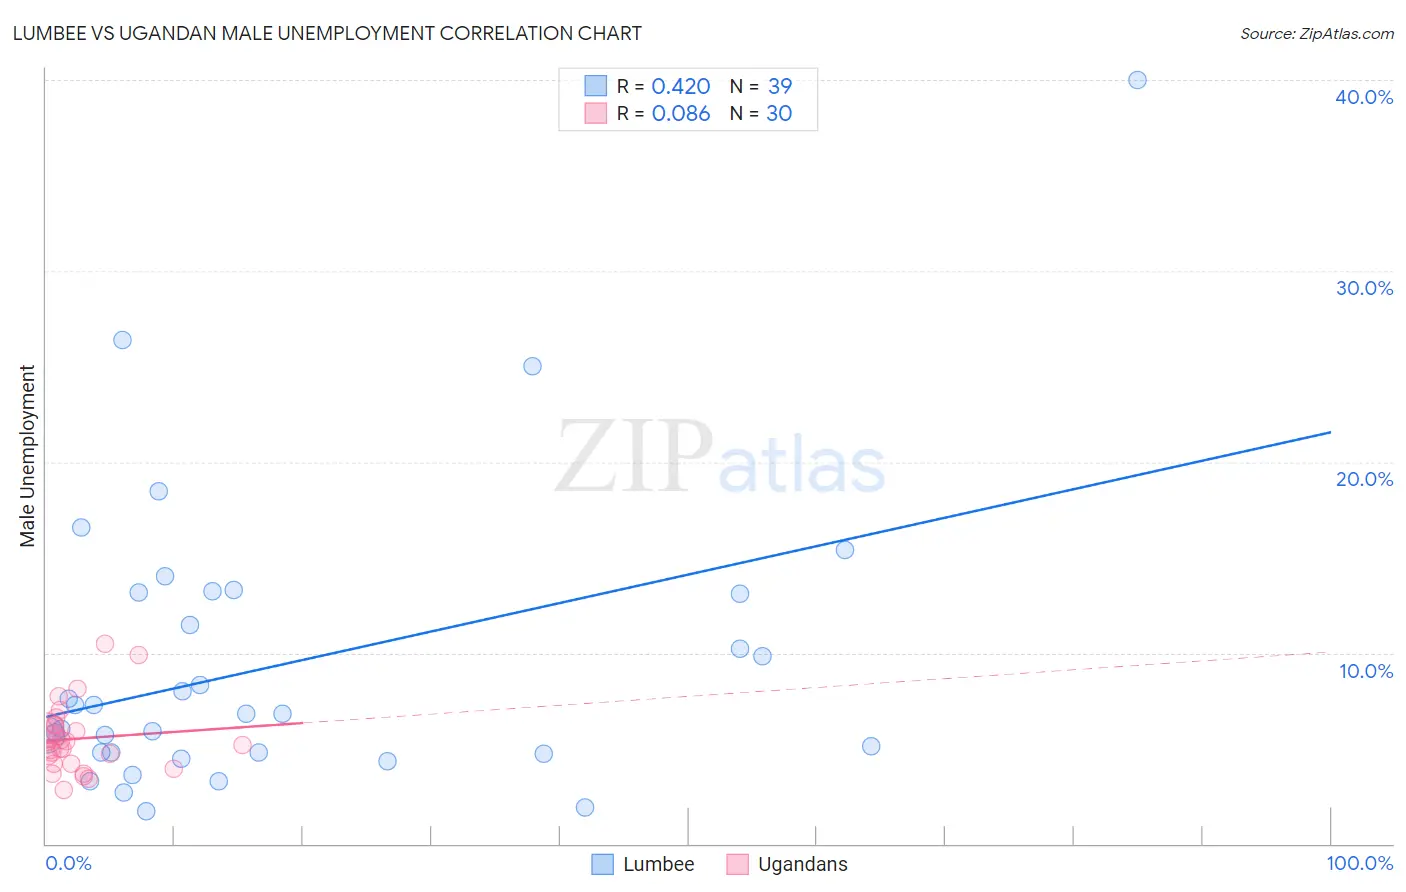
Lumbee vs Ugandan Male Unemployment Correlation Chart
The statistical analysis conducted on geographies consisting of 92,069,666 people shows a moderate positive correlation between the proportion of Lumbee and unemployment rate among males in the United States with a correlation coefficient (R) of 0.420 and weighted average of 6.9%. Similarly, the statistical analysis conducted on geographies consisting of 93,962,786 people shows a slight positive correlation between the proportion of Ugandans and unemployment rate among males in the United States with a correlation coefficient (R) of 0.086 and weighted average of 5.5%, a difference of 26.0%.
Male Unemployment Correlation Summary
| Measurement | Lumbee | Ugandan |
| Minimum | 1.7% | 2.8% |
| Maximum | 40.0% | 10.5% |
| Range | 38.3% | 7.7% |
| Mean | 9.5% | 5.5% |
| Median | 6.8% | 5.3% |
| Interquartile 25% (IQ1) | 4.8% | 4.2% |
| Interquartile 75% (IQ3) | 13.1% | 6.2% |
| Interquartile Range (IQR) | 8.4% | 2.0% |
| Standard Deviation (Sample) | 7.7% | 1.8% |
| Standard Deviation (Population) | 7.6% | 1.8% |
Similar Demographics by Male Unemployment
Demographics Similar to Lumbee by Male Unemployment
In terms of male unemployment, the demographic groups most similar to Lumbee are Immigrants from Armenia (6.9%, a difference of 0.20%), Black/African American (6.9%, a difference of 0.52%), Immigrants from Dominica (7.0%, a difference of 1.0%), Barbadian (6.9%, a difference of 1.2%), and Aleut (6.8%, a difference of 1.6%).
| Demographics | Rating | Rank | Male Unemployment |
| Trinidadians and Tobagonians | 0.0 /100 | #305 | Tragic 6.7% |
| Immigrants | Trinidad and Tobago | 0.0 /100 | #306 | Tragic 6.7% |
| Immigrants | Jamaica | 0.0 /100 | #307 | Tragic 6.7% |
| Aleuts | 0.0 /100 | #308 | Tragic 6.8% |
| Barbadians | 0.0 /100 | #309 | Tragic 6.9% |
| Blacks/African Americans | 0.0 /100 | #310 | Tragic 6.9% |
| Immigrants | Armenia | 0.0 /100 | #311 | Tragic 6.9% |
| Lumbee | 0.0 /100 | #312 | Tragic 6.9% |
| Immigrants | Dominica | 0.0 /100 | #313 | Tragic 7.0% |
| Immigrants | Barbados | 0.0 /100 | #314 | Tragic 7.1% |
| Houma | 0.0 /100 | #315 | Tragic 7.1% |
| Immigrants | Guyana | 0.0 /100 | #316 | Tragic 7.1% |
| Guyanese | 0.0 /100 | #317 | Tragic 7.1% |
| Cape Verdeans | 0.0 /100 | #318 | Tragic 7.1% |
| British West Indians | 0.0 /100 | #319 | Tragic 7.3% |
Demographics Similar to Ugandans by Male Unemployment
In terms of male unemployment, the demographic groups most similar to Ugandans are Hmong (5.5%, a difference of 0.16%), Puget Sound Salish (5.5%, a difference of 0.17%), Israeli (5.5%, a difference of 0.25%), South American Indian (5.5%, a difference of 0.30%), and Samoan (5.5%, a difference of 0.37%).
| Demographics | Rating | Rank | Male Unemployment |
| Immigrants | Ukraine | 9.9 /100 | #206 | Tragic 5.5% |
| Immigrants | Syria | 9.3 /100 | #207 | Tragic 5.5% |
| Immigrants | Lebanon | 8.6 /100 | #208 | Tragic 5.5% |
| Immigrants | Middle Africa | 8.3 /100 | #209 | Tragic 5.5% |
| South American Indians | 7.6 /100 | #210 | Tragic 5.5% |
| Israelis | 7.4 /100 | #211 | Tragic 5.5% |
| Hmong | 7.0 /100 | #212 | Tragic 5.5% |
| Ugandans | 6.3 /100 | #213 | Tragic 5.5% |
| Puget Sound Salish | 5.6 /100 | #214 | Tragic 5.5% |
| Samoans | 4.9 /100 | #215 | Tragic 5.5% |
| Immigrants | Immigrants | 4.3 /100 | #216 | Tragic 5.5% |
| Delaware | 4.2 /100 | #217 | Tragic 5.5% |
| Immigrants | Albania | 3.6 /100 | #218 | Tragic 5.5% |
| Immigrants | Western Asia | 3.5 /100 | #219 | Tragic 5.6% |
| Portuguese | 3.5 /100 | #220 | Tragic 5.6% |