Colombian vs Estonian Unemployment Among Ages 30 to 34 years
COMPARE
Colombian
Estonian
Unemployment Among Ages 30 to 34 years
Unemployment Among Ages 30 to 34 years Comparison
Colombians
Estonians
5.4%
UNEMPLOYMENT AMONG AGES 30 TO 34 YEARS
68.7/ 100
METRIC RATING
150th/ 347
METRIC RANK
5.3%
UNEMPLOYMENT AMONG AGES 30 TO 34 YEARS
83.7/ 100
METRIC RATING
114th/ 347
METRIC RANK
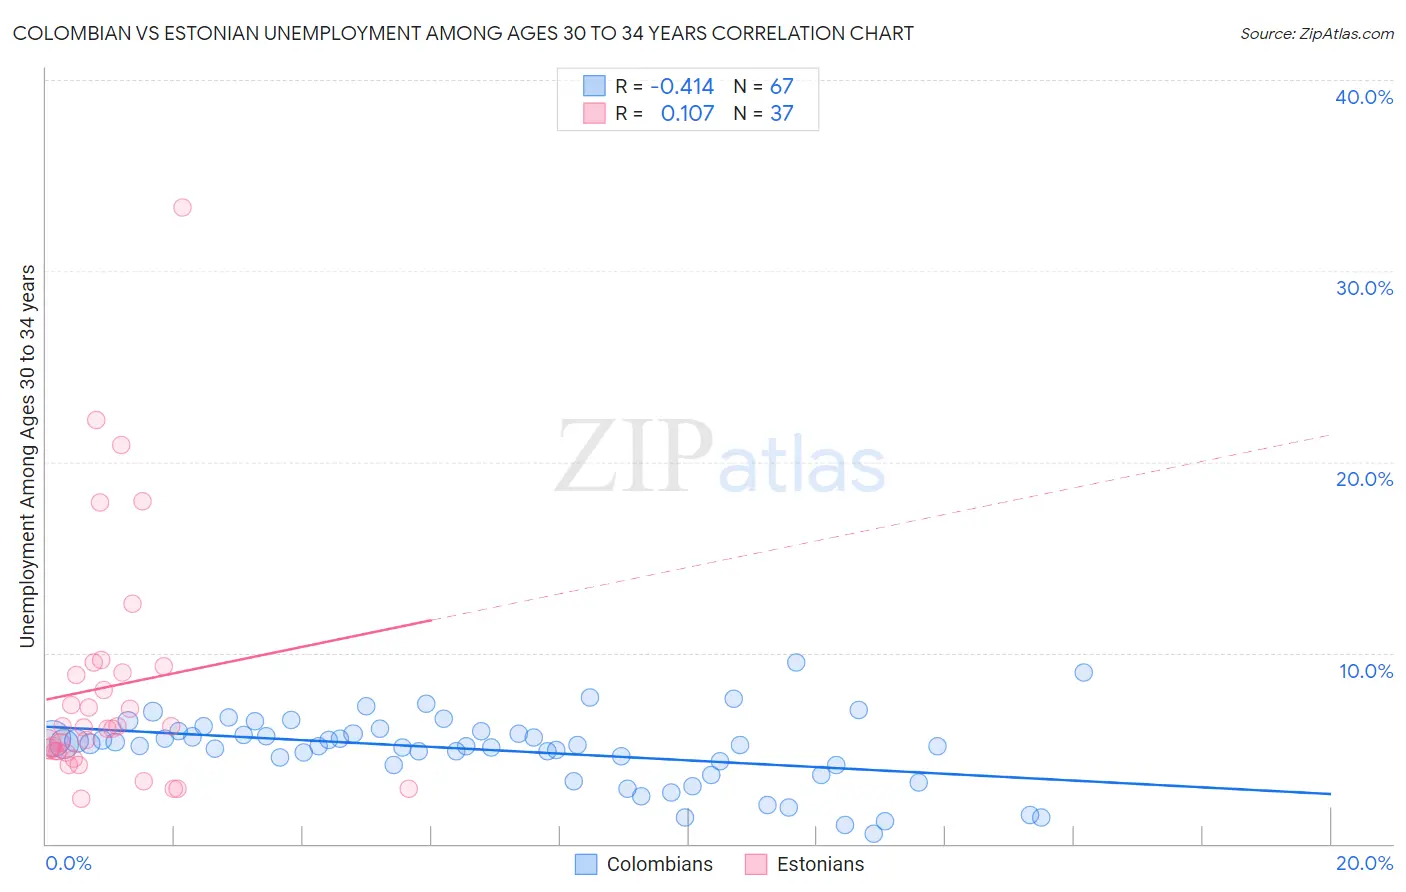
Colombian vs Estonian Unemployment Among Ages 30 to 34 years Correlation Chart
The statistical analysis conducted on geographies consisting of 395,074,918 people shows a moderate negative correlation between the proportion of Colombians and unemployment rate among population between the ages 30 and 34 in the United States with a correlation coefficient (R) of -0.414 and weighted average of 5.4%. Similarly, the statistical analysis conducted on geographies consisting of 120,374,658 people shows a poor positive correlation between the proportion of Estonians and unemployment rate among population between the ages 30 and 34 in the United States with a correlation coefficient (R) of 0.107 and weighted average of 5.3%, a difference of 1.5%.
Unemployment Among Ages 30 to 34 years Correlation Summary
| Measurement | Colombian | Estonian |
| Minimum | 0.54% | 2.3% |
| Maximum | 9.5% | 33.3% |
| Range | 9.0% | 31.0% |
| Mean | 4.9% | 8.2% |
| Median | 5.2% | 6.1% |
| Interquartile 25% (IQ1) | 4.1% | 4.8% |
| Interquartile 75% (IQ3) | 5.9% | 9.1% |
| Interquartile Range (IQR) | 1.8% | 4.3% |
| Standard Deviation (Sample) | 1.9% | 6.5% |
| Standard Deviation (Population) | 1.8% | 6.4% |
Similar Demographics by Unemployment Among Ages 30 to 34 years
Demographics Similar to Colombians by Unemployment Among Ages 30 to 34 years
In terms of unemployment among ages 30 to 34 years, the demographic groups most similar to Colombians are Immigrants from Colombia (5.4%, a difference of 0.010%), Immigrants from Iran (5.4%, a difference of 0.030%), Ukrainian (5.4%, a difference of 0.040%), Immigrants from Oceania (5.4%, a difference of 0.050%), and Celtic (5.4%, a difference of 0.12%).
| Demographics | Rating | Rank | Unemployment Among Ages 30 to 34 years |
| Russians | 71.1 /100 | #143 | Good 5.4% |
| Immigrants | Russia | 71.0 /100 | #144 | Good 5.4% |
| Syrians | 70.3 /100 | #145 | Good 5.4% |
| Celtics | 70.2 /100 | #146 | Good 5.4% |
| Ukrainians | 69.2 /100 | #147 | Good 5.4% |
| Immigrants | Iran | 69.1 /100 | #148 | Good 5.4% |
| Immigrants | Colombia | 68.9 /100 | #149 | Good 5.4% |
| Colombians | 68.7 /100 | #150 | Good 5.4% |
| Immigrants | Oceania | 68.1 /100 | #151 | Good 5.4% |
| Lebanese | 67.2 /100 | #152 | Good 5.4% |
| Immigrants | South Eastern Asia | 66.5 /100 | #153 | Good 5.4% |
| South Africans | 66.5 /100 | #154 | Good 5.4% |
| Immigrants | Hungary | 66.1 /100 | #155 | Good 5.4% |
| Czechoslovakians | 63.7 /100 | #156 | Good 5.4% |
| Albanians | 63.7 /100 | #157 | Good 5.4% |
Demographics Similar to Estonians by Unemployment Among Ages 30 to 34 years
In terms of unemployment among ages 30 to 34 years, the demographic groups most similar to Estonians are Immigrants from Albania (5.3%, a difference of 0.040%), Eastern European (5.3%, a difference of 0.070%), Australian (5.3%, a difference of 0.080%), Immigrants from South Africa (5.3%, a difference of 0.090%), and New Zealander (5.3%, a difference of 0.15%).
| Demographics | Rating | Rank | Unemployment Among Ages 30 to 34 years |
| Icelanders | 87.2 /100 | #107 | Excellent 5.3% |
| Immigrants | Middle Africa | 87.1 /100 | #108 | Excellent 5.3% |
| Immigrants | Chile | 86.7 /100 | #109 | Excellent 5.3% |
| Egyptians | 86.4 /100 | #110 | Excellent 5.3% |
| Immigrants | Pakistan | 86.2 /100 | #111 | Excellent 5.3% |
| Swiss | 85.9 /100 | #112 | Excellent 5.3% |
| Immigrants | Spain | 85.6 /100 | #113 | Excellent 5.3% |
| Estonians | 83.7 /100 | #114 | Excellent 5.3% |
| Immigrants | Albania | 83.4 /100 | #115 | Excellent 5.3% |
| Eastern Europeans | 83.2 /100 | #116 | Excellent 5.3% |
| Australians | 83.1 /100 | #117 | Excellent 5.3% |
| Immigrants | South Africa | 83.0 /100 | #118 | Excellent 5.3% |
| New Zealanders | 82.5 /100 | #119 | Excellent 5.3% |
| Immigrants | Poland | 82.4 /100 | #120 | Excellent 5.3% |
| Romanians | 82.3 /100 | #121 | Excellent 5.3% |