Mongolian vs Estonian Unemployment Among Ages 30 to 34 years
COMPARE
Mongolian
Estonian
Unemployment Among Ages 30 to 34 years
Unemployment Among Ages 30 to 34 years Comparison
Mongolians
Estonians
5.2%
UNEMPLOYMENT AMONG AGES 30 TO 34 YEARS
91.7/ 100
METRIC RATING
96th/ 347
METRIC RANK
5.3%
UNEMPLOYMENT AMONG AGES 30 TO 34 YEARS
83.7/ 100
METRIC RATING
114th/ 347
METRIC RANK
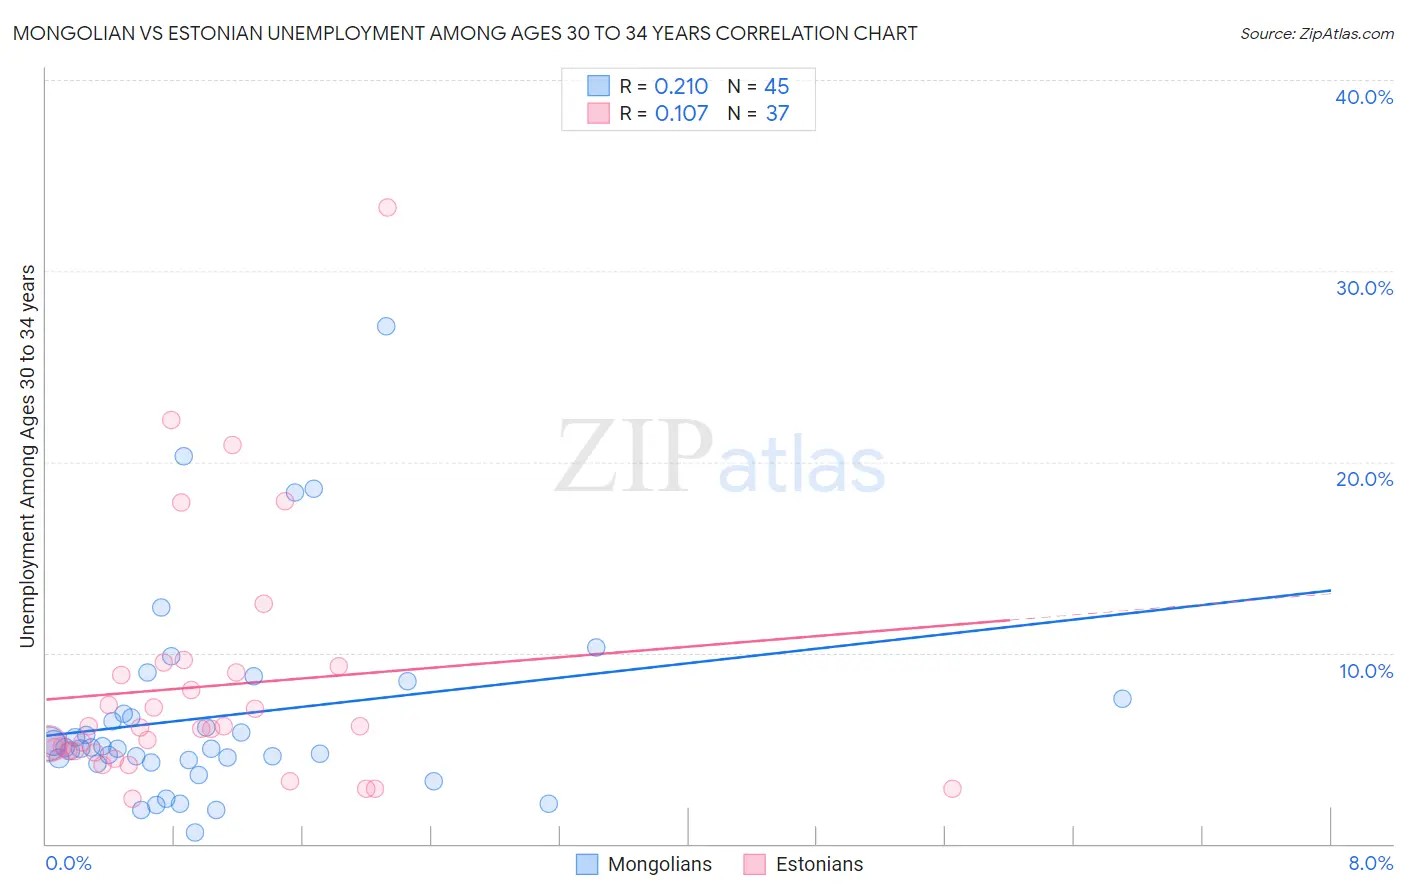
Mongolian vs Estonian Unemployment Among Ages 30 to 34 years Correlation Chart
The statistical analysis conducted on geographies consisting of 137,790,931 people shows a weak positive correlation between the proportion of Mongolians and unemployment rate among population between the ages 30 and 34 in the United States with a correlation coefficient (R) of 0.210 and weighted average of 5.2%. Similarly, the statistical analysis conducted on geographies consisting of 120,374,658 people shows a poor positive correlation between the proportion of Estonians and unemployment rate among population between the ages 30 and 34 in the United States with a correlation coefficient (R) of 0.107 and weighted average of 5.3%, a difference of 1.4%.
Unemployment Among Ages 30 to 34 years Correlation Summary
| Measurement | Mongolian | Estonian |
| Minimum | 0.60% | 2.3% |
| Maximum | 27.1% | 33.3% |
| Range | 26.5% | 31.0% |
| Mean | 6.7% | 8.2% |
| Median | 5.0% | 6.1% |
| Interquartile 25% (IQ1) | 4.3% | 4.8% |
| Interquartile 75% (IQ3) | 7.2% | 9.1% |
| Interquartile Range (IQR) | 2.9% | 4.3% |
| Standard Deviation (Sample) | 5.2% | 6.5% |
| Standard Deviation (Population) | 5.2% | 6.4% |
Demographics Similar to Mongolians and Estonians by Unemployment Among Ages 30 to 34 years
In terms of unemployment among ages 30 to 34 years, the demographic groups most similar to Mongolians are European (5.2%, a difference of 0.010%), Kenyan (5.2%, a difference of 0.090%), Immigrants from North Macedonia (5.2%, a difference of 0.19%), Immigrants from Ireland (5.2%, a difference of 0.25%), and Immigrants from Czechoslovakia (5.3%, a difference of 0.46%). Similarly, the demographic groups most similar to Estonians are Immigrants from Albania (5.3%, a difference of 0.040%), Immigrants from Spain (5.3%, a difference of 0.26%), Swiss (5.3%, a difference of 0.31%), Immigrants from Pakistan (5.3%, a difference of 0.36%), and Egyptian (5.3%, a difference of 0.38%).
| Demographics | Rating | Rank | Unemployment Among Ages 30 to 34 years |
| Kenyans | 92.1 /100 | #95 | Exceptional 5.2% |
| Mongolians | 91.7 /100 | #96 | Exceptional 5.2% |
| Europeans | 91.7 /100 | #97 | Exceptional 5.2% |
| Immigrants | North Macedonia | 90.9 /100 | #98 | Exceptional 5.2% |
| Immigrants | Ireland | 90.6 /100 | #99 | Exceptional 5.2% |
| Immigrants | Czechoslovakia | 89.5 /100 | #100 | Excellent 5.3% |
| British | 89.1 /100 | #101 | Excellent 5.3% |
| Immigrants | Switzerland | 88.8 /100 | #102 | Excellent 5.3% |
| Immigrants | Jordan | 88.8 /100 | #103 | Excellent 5.3% |
| Northern Europeans | 87.9 /100 | #104 | Excellent 5.3% |
| Argentineans | 87.9 /100 | #105 | Excellent 5.3% |
| Croatians | 87.6 /100 | #106 | Excellent 5.3% |
| Icelanders | 87.2 /100 | #107 | Excellent 5.3% |
| Immigrants | Middle Africa | 87.1 /100 | #108 | Excellent 5.3% |
| Immigrants | Chile | 86.7 /100 | #109 | Excellent 5.3% |
| Egyptians | 86.4 /100 | #110 | Excellent 5.3% |
| Immigrants | Pakistan | 86.2 /100 | #111 | Excellent 5.3% |
| Swiss | 85.9 /100 | #112 | Excellent 5.3% |
| Immigrants | Spain | 85.6 /100 | #113 | Excellent 5.3% |
| Estonians | 83.7 /100 | #114 | Excellent 5.3% |
| Immigrants | Albania | 83.4 /100 | #115 | Excellent 5.3% |