Liberian vs Immigrants from Liberia Unemployment Among Seniors over 75 years
COMPARE
Liberian
Immigrants from Liberia
Unemployment Among Seniors over 75 years
Unemployment Among Seniors over 75 years Comparison
Liberians
Immigrants from Liberia
10.2%
UNEMPLOYMENT AMONG SENIORS OVER 75 YEARS
0.0/ 100
METRIC RATING
318th/ 347
METRIC RANK
10.9%
UNEMPLOYMENT AMONG SENIORS OVER 75 YEARS
0.0/ 100
METRIC RATING
332nd/ 347
METRIC RANK
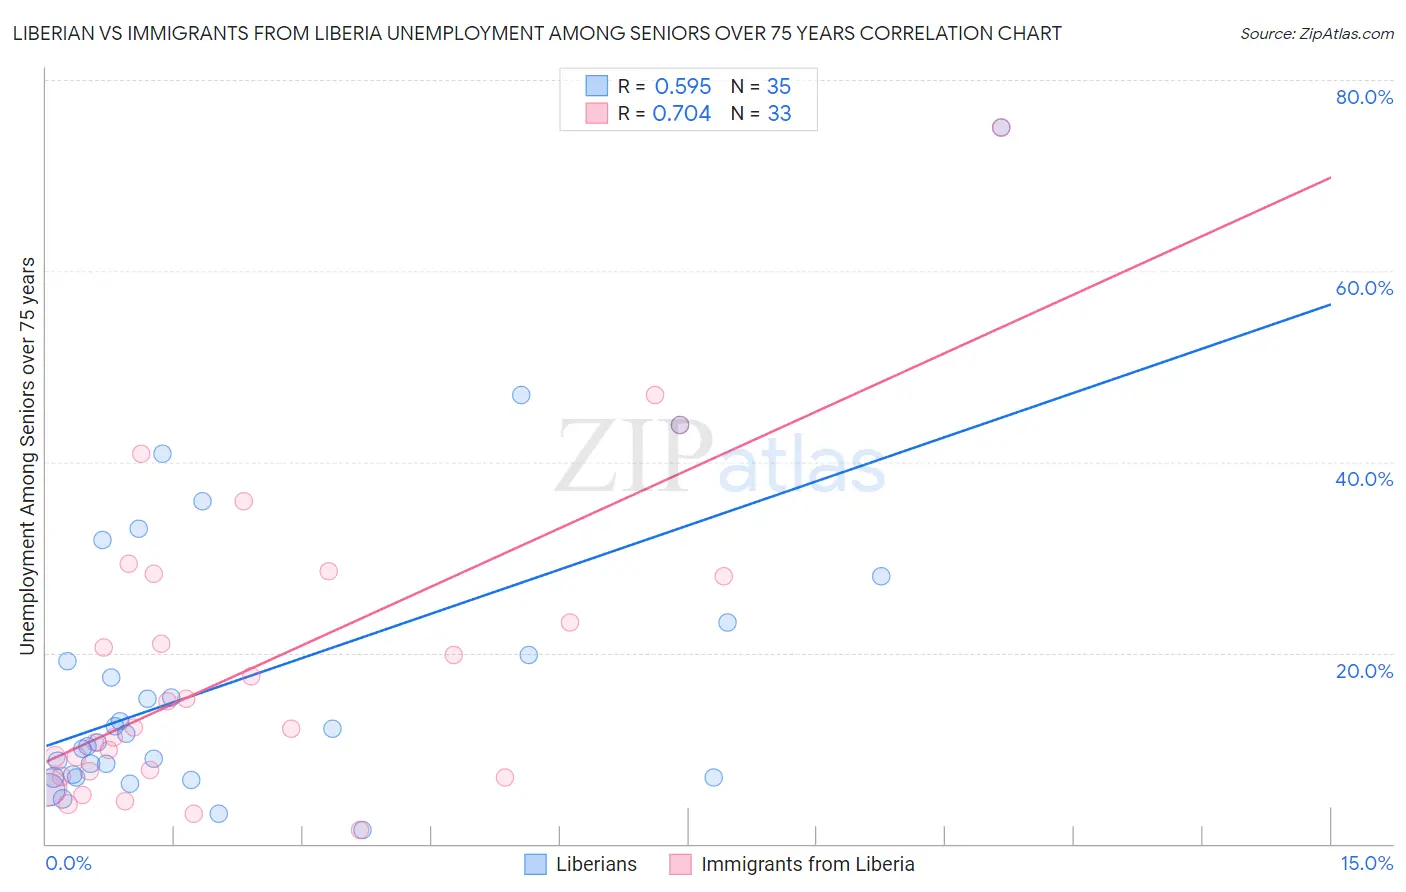
Liberian vs Immigrants from Liberia Unemployment Among Seniors over 75 years Correlation Chart
The statistical analysis conducted on geographies consisting of 84,949,227 people shows a substantial positive correlation between the proportion of Liberians and unemployment rate among seniors over the age of 75 in the United States with a correlation coefficient (R) of 0.595 and weighted average of 10.2%. Similarly, the statistical analysis conducted on geographies consisting of 94,243,909 people shows a strong positive correlation between the proportion of Immigrants from Liberia and unemployment rate among seniors over the age of 75 in the United States with a correlation coefficient (R) of 0.704 and weighted average of 10.9%, a difference of 6.3%.
Unemployment Among Seniors over 75 years Correlation Summary
| Measurement | Liberian | Immigrants from Liberia |
| Minimum | 1.4% | 1.4% |
| Maximum | 75.0% | 75.0% |
| Range | 73.6% | 73.6% |
| Mean | 17.6% | 18.7% |
| Median | 11.5% | 12.2% |
| Interquartile 25% (IQ1) | 7.0% | 7.4% |
| Interquartile 75% (IQ3) | 23.2% | 28.2% |
| Interquartile Range (IQR) | 16.2% | 20.8% |
| Standard Deviation (Sample) | 15.7% | 15.9% |
| Standard Deviation (Population) | 15.5% | 15.7% |
Demographics Similar to Liberians and Immigrants from Liberia by Unemployment Among Seniors over 75 years
In terms of unemployment among seniors over 75 years, the demographic groups most similar to Liberians are German (10.3%, a difference of 0.070%), Irish (10.2%, a difference of 0.12%), French (10.3%, a difference of 0.29%), Aleut (10.3%, a difference of 0.31%), and Native/Alaskan (10.2%, a difference of 0.49%). Similarly, the demographic groups most similar to Immigrants from Liberia are Tohono O'odham (10.8%, a difference of 0.72%), Alaskan Athabascan (11.0%, a difference of 1.2%), Assyrian/Chaldean/Syriac (11.1%, a difference of 1.5%), Immigrants from the Azores (10.7%, a difference of 1.8%), and French Canadian (11.2%, a difference of 2.7%).
| Demographics | Rating | Rank | Unemployment Among Seniors over 75 years |
| Pennsylvania Germans | 0.0 /100 | #315 | Tragic 10.2% |
| Natives/Alaskans | 0.0 /100 | #316 | Tragic 10.2% |
| Irish | 0.0 /100 | #317 | Tragic 10.2% |
| Liberians | 0.0 /100 | #318 | Tragic 10.2% |
| Germans | 0.0 /100 | #319 | Tragic 10.3% |
| French | 0.0 /100 | #320 | Tragic 10.3% |
| Aleuts | 0.0 /100 | #321 | Tragic 10.3% |
| Poles | 0.0 /100 | #322 | Tragic 10.3% |
| Tongans | 0.0 /100 | #323 | Tragic 10.4% |
| Americans | 0.0 /100 | #324 | Tragic 10.4% |
| Portuguese | 0.0 /100 | #325 | Tragic 10.4% |
| Slovaks | 0.0 /100 | #326 | Tragic 10.4% |
| Dutch | 0.0 /100 | #327 | Tragic 10.4% |
| Immigrants | Portugal | 0.0 /100 | #328 | Tragic 10.5% |
| Tsimshian | 0.0 /100 | #329 | Tragic 10.5% |
| Immigrants | Azores | 0.0 /100 | #330 | Tragic 10.7% |
| Tohono O'odham | 0.0 /100 | #331 | Tragic 10.8% |
| Immigrants | Liberia | 0.0 /100 | #332 | Tragic 10.9% |
| Alaskan Athabascans | 0.0 /100 | #333 | Tragic 11.0% |
| Assyrians/Chaldeans/Syriacs | 0.0 /100 | #334 | Tragic 11.1% |
| French Canadians | 0.0 /100 | #335 | Tragic 11.2% |