Immigrants from El Salvador vs Hungarian Unemployment Among Seniors over 75 years
COMPARE
Immigrants from El Salvador
Hungarian
Unemployment Among Seniors over 75 years
Unemployment Among Seniors over 75 years Comparison
Immigrants from El Salvador
Hungarians
8.7%
UNEMPLOYMENT AMONG SENIORS OVER 75 YEARS
49.7/ 100
METRIC RATING
174th/ 347
METRIC RANK
10.1%
UNEMPLOYMENT AMONG SENIORS OVER 75 YEARS
0.0/ 100
METRIC RATING
310th/ 347
METRIC RANK
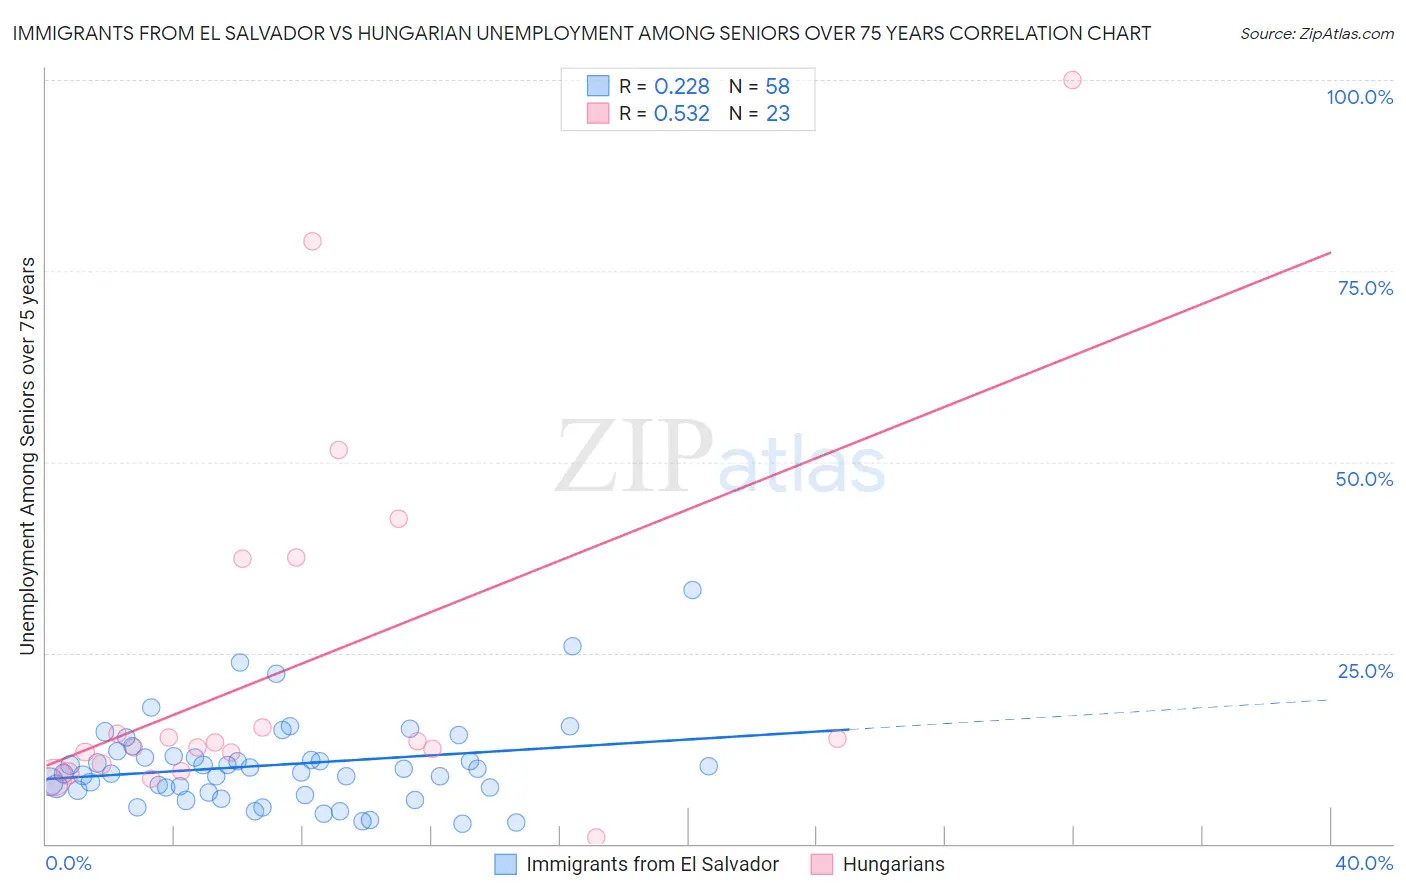
Immigrants from El Salvador vs Hungarian Unemployment Among Seniors over 75 years Correlation Chart
The statistical analysis conducted on geographies consisting of 188,554,636 people shows a weak positive correlation between the proportion of Immigrants from El Salvador and unemployment rate among seniors over the age of 75 in the United States with a correlation coefficient (R) of 0.228 and weighted average of 8.7%. Similarly, the statistical analysis conducted on geographies consisting of 221,758,984 people shows a substantial positive correlation between the proportion of Hungarians and unemployment rate among seniors over the age of 75 in the United States with a correlation coefficient (R) of 0.532 and weighted average of 10.1%, a difference of 15.3%.
Unemployment Among Seniors over 75 years Correlation Summary
| Measurement | Immigrants from El Salvador | Hungarian |
| Minimum | 2.7% | 0.90% |
| Maximum | 33.3% | 100.0% |
| Range | 30.6% | 99.1% |
| Mean | 10.3% | 23.5% |
| Median | 9.6% | 13.2% |
| Interquartile 25% (IQ1) | 7.0% | 10.4% |
| Interquartile 75% (IQ3) | 11.5% | 37.3% |
| Interquartile Range (IQR) | 4.5% | 26.9% |
| Standard Deviation (Sample) | 5.7% | 24.5% |
| Standard Deviation (Population) | 5.7% | 23.9% |
Similar Demographics by Unemployment Among Seniors over 75 years
Demographics Similar to Immigrants from El Salvador by Unemployment Among Seniors over 75 years
In terms of unemployment among seniors over 75 years, the demographic groups most similar to Immigrants from El Salvador are Syrian (8.7%, a difference of 0.010%), Australian (8.7%, a difference of 0.030%), Immigrants (8.7%, a difference of 0.11%), Dominican (8.7%, a difference of 0.12%), and Zimbabwean (8.7%, a difference of 0.24%).
| Demographics | Rating | Rank | Unemployment Among Seniors over 75 years |
| Immigrants | Eastern Africa | 57.6 /100 | #167 | Average 8.7% |
| Immigrants | Lithuania | 57.2 /100 | #168 | Average 8.7% |
| Fijians | 56.4 /100 | #169 | Average 8.7% |
| Zimbabweans | 54.1 /100 | #170 | Average 8.7% |
| Dominicans | 51.9 /100 | #171 | Average 8.7% |
| Immigrants | Immigrants | 51.8 /100 | #172 | Average 8.7% |
| Australians | 50.3 /100 | #173 | Average 8.7% |
| Immigrants | El Salvador | 49.7 /100 | #174 | Average 8.7% |
| Syrians | 49.6 /100 | #175 | Average 8.7% |
| Somalis | 45.3 /100 | #176 | Average 8.8% |
| Central Americans | 43.3 /100 | #177 | Average 8.8% |
| West Indians | 41.9 /100 | #178 | Average 8.8% |
| Immigrants | Italy | 41.7 /100 | #179 | Average 8.8% |
| Immigrants | Somalia | 41.7 /100 | #180 | Average 8.8% |
| Immigrants | Thailand | 40.2 /100 | #181 | Average 8.8% |
Demographics Similar to Hungarians by Unemployment Among Seniors over 75 years
In terms of unemployment among seniors over 75 years, the demographic groups most similar to Hungarians are Scottish (10.1%, a difference of 0.11%), Chippewa (10.1%, a difference of 0.13%), English (10.1%, a difference of 0.19%), White/Caucasian (10.1%, a difference of 0.25%), and Nepalese (10.1%, a difference of 0.25%).
| Demographics | Rating | Rank | Unemployment Among Seniors over 75 years |
| Puget Sound Salish | 0.0 /100 | #303 | Tragic 10.0% |
| Scotch-Irish | 0.0 /100 | #304 | Tragic 10.0% |
| Swedes | 0.0 /100 | #305 | Tragic 10.0% |
| Italians | 0.0 /100 | #306 | Tragic 10.0% |
| Immigrants | Fiji | 0.0 /100 | #307 | Tragic 10.0% |
| Whites/Caucasians | 0.0 /100 | #308 | Tragic 10.1% |
| English | 0.0 /100 | #309 | Tragic 10.1% |
| Hungarians | 0.0 /100 | #310 | Tragic 10.1% |
| Scottish | 0.0 /100 | #311 | Tragic 10.1% |
| Chippewa | 0.0 /100 | #312 | Tragic 10.1% |
| Nepalese | 0.0 /100 | #313 | Tragic 10.1% |
| Dutch West Indians | 0.0 /100 | #314 | Tragic 10.2% |
| Pennsylvania Germans | 0.0 /100 | #315 | Tragic 10.2% |
| Natives/Alaskans | 0.0 /100 | #316 | Tragic 10.2% |
| Irish | 0.0 /100 | #317 | Tragic 10.2% |