Liberian vs Ukrainian Unemployment Among Seniors over 75 years
COMPARE
Liberian
Ukrainian
Unemployment Among Seniors over 75 years
Unemployment Among Seniors over 75 years Comparison
Liberians
Ukrainians
10.2%
UNEMPLOYMENT AMONG SENIORS OVER 75 YEARS
0.0/ 100
METRIC RATING
318th/ 347
METRIC RANK
9.3%
UNEMPLOYMENT AMONG SENIORS OVER 75 YEARS
0.7/ 100
METRIC RATING
263rd/ 347
METRIC RANK
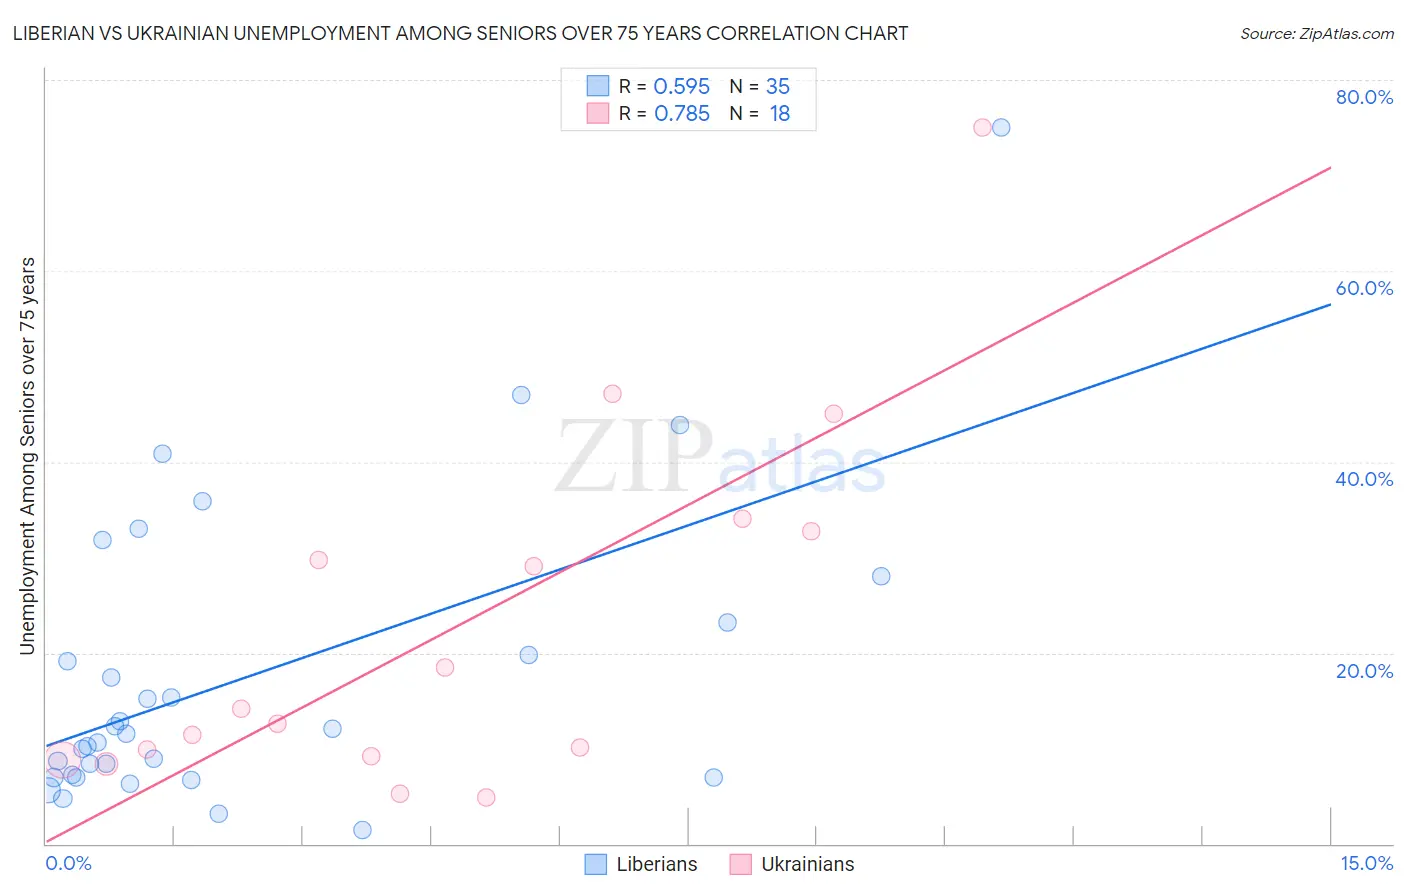
Liberian vs Ukrainian Unemployment Among Seniors over 75 years Correlation Chart
The statistical analysis conducted on geographies consisting of 84,949,227 people shows a substantial positive correlation between the proportion of Liberians and unemployment rate among seniors over the age of 75 in the United States with a correlation coefficient (R) of 0.595 and weighted average of 10.2%. Similarly, the statistical analysis conducted on geographies consisting of 214,568,076 people shows a strong positive correlation between the proportion of Ukrainians and unemployment rate among seniors over the age of 75 in the United States with a correlation coefficient (R) of 0.785 and weighted average of 9.3%, a difference of 9.8%.
Unemployment Among Seniors over 75 years Correlation Summary
| Measurement | Liberian | Ukrainian |
| Minimum | 1.4% | 4.8% |
| Maximum | 75.0% | 75.0% |
| Range | 73.6% | 70.2% |
| Mean | 17.6% | 22.5% |
| Median | 11.5% | 13.3% |
| Interquartile 25% (IQ1) | 7.0% | 9.2% |
| Interquartile 75% (IQ3) | 23.2% | 32.7% |
| Interquartile Range (IQR) | 16.2% | 23.5% |
| Standard Deviation (Sample) | 15.7% | 18.8% |
| Standard Deviation (Population) | 15.5% | 18.3% |
Similar Demographics by Unemployment Among Seniors over 75 years
Demographics Similar to Liberians by Unemployment Among Seniors over 75 years
In terms of unemployment among seniors over 75 years, the demographic groups most similar to Liberians are German (10.3%, a difference of 0.070%), Irish (10.2%, a difference of 0.12%), French (10.3%, a difference of 0.29%), Aleut (10.3%, a difference of 0.31%), and Native/Alaskan (10.2%, a difference of 0.49%).
| Demographics | Rating | Rank | Unemployment Among Seniors over 75 years |
| Scottish | 0.0 /100 | #311 | Tragic 10.1% |
| Chippewa | 0.0 /100 | #312 | Tragic 10.1% |
| Nepalese | 0.0 /100 | #313 | Tragic 10.1% |
| Dutch West Indians | 0.0 /100 | #314 | Tragic 10.2% |
| Pennsylvania Germans | 0.0 /100 | #315 | Tragic 10.2% |
| Natives/Alaskans | 0.0 /100 | #316 | Tragic 10.2% |
| Irish | 0.0 /100 | #317 | Tragic 10.2% |
| Liberians | 0.0 /100 | #318 | Tragic 10.2% |
| Germans | 0.0 /100 | #319 | Tragic 10.3% |
| French | 0.0 /100 | #320 | Tragic 10.3% |
| Aleuts | 0.0 /100 | #321 | Tragic 10.3% |
| Poles | 0.0 /100 | #322 | Tragic 10.3% |
| Tongans | 0.0 /100 | #323 | Tragic 10.4% |
| Americans | 0.0 /100 | #324 | Tragic 10.4% |
| Portuguese | 0.0 /100 | #325 | Tragic 10.4% |
Demographics Similar to Ukrainians by Unemployment Among Seniors over 75 years
In terms of unemployment among seniors over 75 years, the demographic groups most similar to Ukrainians are Iroquois (9.3%, a difference of 0.010%), Austrian (9.3%, a difference of 0.12%), Palestinian (9.3%, a difference of 0.13%), Celtic (9.3%, a difference of 0.22%), and Black/African American (9.4%, a difference of 0.46%).
| Demographics | Rating | Rank | Unemployment Among Seniors over 75 years |
| Brazilians | 1.3 /100 | #256 | Tragic 9.3% |
| Hawaiians | 1.2 /100 | #257 | Tragic 9.3% |
| Immigrants | England | 1.0 /100 | #258 | Tragic 9.3% |
| Slovenes | 1.0 /100 | #259 | Tragic 9.3% |
| Immigrants | Cameroon | 1.0 /100 | #260 | Tragic 9.3% |
| Celtics | 0.8 /100 | #261 | Tragic 9.3% |
| Austrians | 0.7 /100 | #262 | Tragic 9.3% |
| Ukrainians | 0.7 /100 | #263 | Tragic 9.3% |
| Iroquois | 0.7 /100 | #264 | Tragic 9.3% |
| Palestinians | 0.6 /100 | #265 | Tragic 9.3% |
| Blacks/African Americans | 0.5 /100 | #266 | Tragic 9.4% |
| Immigrants | Mexico | 0.4 /100 | #267 | Tragic 9.4% |
| Greeks | 0.4 /100 | #268 | Tragic 9.4% |
| Puerto Ricans | 0.3 /100 | #269 | Tragic 9.4% |
| Yaqui | 0.3 /100 | #270 | Tragic 9.4% |