Liberian vs Immigrants from Panama Unemployment Among Seniors over 75 years
COMPARE
Liberian
Immigrants from Panama
Unemployment Among Seniors over 75 years
Unemployment Among Seniors over 75 years Comparison
Liberians
Immigrants from Panama
10.2%
UNEMPLOYMENT AMONG SENIORS OVER 75 YEARS
0.0/ 100
METRIC RATING
318th/ 347
METRIC RANK
8.2%
UNEMPLOYMENT AMONG SENIORS OVER 75 YEARS
99.1/ 100
METRIC RATING
102nd/ 347
METRIC RANK
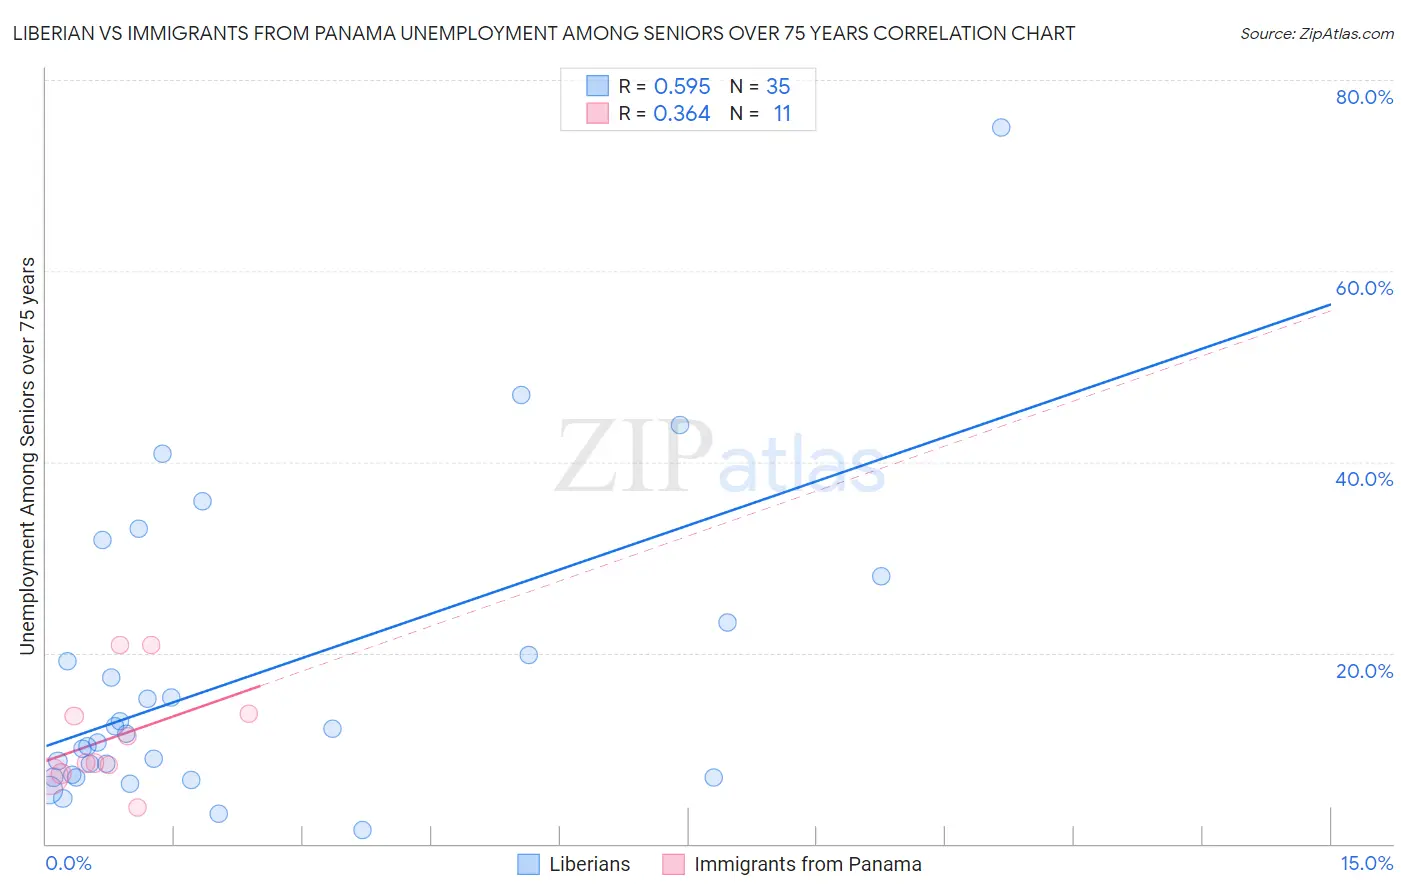
Liberian vs Immigrants from Panama Unemployment Among Seniors over 75 years Correlation Chart
The statistical analysis conducted on geographies consisting of 84,949,227 people shows a substantial positive correlation between the proportion of Liberians and unemployment rate among seniors over the age of 75 in the United States with a correlation coefficient (R) of 0.595 and weighted average of 10.2%. Similarly, the statistical analysis conducted on geographies consisting of 135,651,203 people shows a mild positive correlation between the proportion of Immigrants from Panama and unemployment rate among seniors over the age of 75 in the United States with a correlation coefficient (R) of 0.364 and weighted average of 8.2%, a difference of 25.1%.
Unemployment Among Seniors over 75 years Correlation Summary
| Measurement | Liberian | Immigrants from Panama |
| Minimum | 1.4% | 3.8% |
| Maximum | 75.0% | 20.8% |
| Range | 73.6% | 17.0% |
| Mean | 17.6% | 11.2% |
| Median | 11.5% | 8.5% |
| Interquartile 25% (IQ1) | 7.0% | 7.3% |
| Interquartile 75% (IQ3) | 23.2% | 13.6% |
| Interquartile Range (IQR) | 16.2% | 6.3% |
| Standard Deviation (Sample) | 15.7% | 5.5% |
| Standard Deviation (Population) | 15.5% | 5.3% |
Similar Demographics by Unemployment Among Seniors over 75 years
Demographics Similar to Liberians by Unemployment Among Seniors over 75 years
In terms of unemployment among seniors over 75 years, the demographic groups most similar to Liberians are German (10.3%, a difference of 0.070%), Irish (10.2%, a difference of 0.12%), French (10.3%, a difference of 0.29%), Aleut (10.3%, a difference of 0.31%), and Native/Alaskan (10.2%, a difference of 0.49%).
| Demographics | Rating | Rank | Unemployment Among Seniors over 75 years |
| Scottish | 0.0 /100 | #311 | Tragic 10.1% |
| Chippewa | 0.0 /100 | #312 | Tragic 10.1% |
| Nepalese | 0.0 /100 | #313 | Tragic 10.1% |
| Dutch West Indians | 0.0 /100 | #314 | Tragic 10.2% |
| Pennsylvania Germans | 0.0 /100 | #315 | Tragic 10.2% |
| Natives/Alaskans | 0.0 /100 | #316 | Tragic 10.2% |
| Irish | 0.0 /100 | #317 | Tragic 10.2% |
| Liberians | 0.0 /100 | #318 | Tragic 10.2% |
| Germans | 0.0 /100 | #319 | Tragic 10.3% |
| French | 0.0 /100 | #320 | Tragic 10.3% |
| Aleuts | 0.0 /100 | #321 | Tragic 10.3% |
| Poles | 0.0 /100 | #322 | Tragic 10.3% |
| Tongans | 0.0 /100 | #323 | Tragic 10.4% |
| Americans | 0.0 /100 | #324 | Tragic 10.4% |
| Portuguese | 0.0 /100 | #325 | Tragic 10.4% |
Demographics Similar to Immigrants from Panama by Unemployment Among Seniors over 75 years
In terms of unemployment among seniors over 75 years, the demographic groups most similar to Immigrants from Panama are Immigrants from Serbia (8.2%, a difference of 0.090%), Immigrants from Kazakhstan (8.2%, a difference of 0.14%), Burmese (8.2%, a difference of 0.15%), South American Indian (8.2%, a difference of 0.15%), and Immigrants from South Central Asia (8.2%, a difference of 0.18%).
| Demographics | Rating | Rank | Unemployment Among Seniors over 75 years |
| Nicaraguans | 99.3 /100 | #95 | Exceptional 8.2% |
| Immigrants | Belgium | 99.3 /100 | #96 | Exceptional 8.2% |
| Immigrants | Sri Lanka | 99.3 /100 | #97 | Exceptional 8.2% |
| Immigrants | Northern Africa | 99.3 /100 | #98 | Exceptional 8.2% |
| Burmese | 99.2 /100 | #99 | Exceptional 8.2% |
| Immigrants | Kazakhstan | 99.2 /100 | #100 | Exceptional 8.2% |
| Immigrants | Serbia | 99.2 /100 | #101 | Exceptional 8.2% |
| Immigrants | Panama | 99.1 /100 | #102 | Exceptional 8.2% |
| South American Indians | 99.1 /100 | #103 | Exceptional 8.2% |
| Immigrants | South Central Asia | 99.0 /100 | #104 | Exceptional 8.2% |
| Immigrants | Caribbean | 99.0 /100 | #105 | Exceptional 8.2% |
| Immigrants | Honduras | 99.0 /100 | #106 | Exceptional 8.2% |
| Sri Lankans | 98.9 /100 | #107 | Exceptional 8.2% |
| Laotians | 98.8 /100 | #108 | Exceptional 8.2% |
| Immigrants | Lebanon | 98.8 /100 | #109 | Exceptional 8.2% |