Latvian vs Scottish Male Unemployment
COMPARE
Latvian
Scottish
Male Unemployment
Male Unemployment Comparison
Latvians
Scottish
4.8%
MALE UNEMPLOYMENT
99.7/ 100
METRIC RATING
33rd/ 347
METRIC RANK
4.8%
MALE UNEMPLOYMENT
99.8/ 100
METRIC RATING
29th/ 347
METRIC RANK
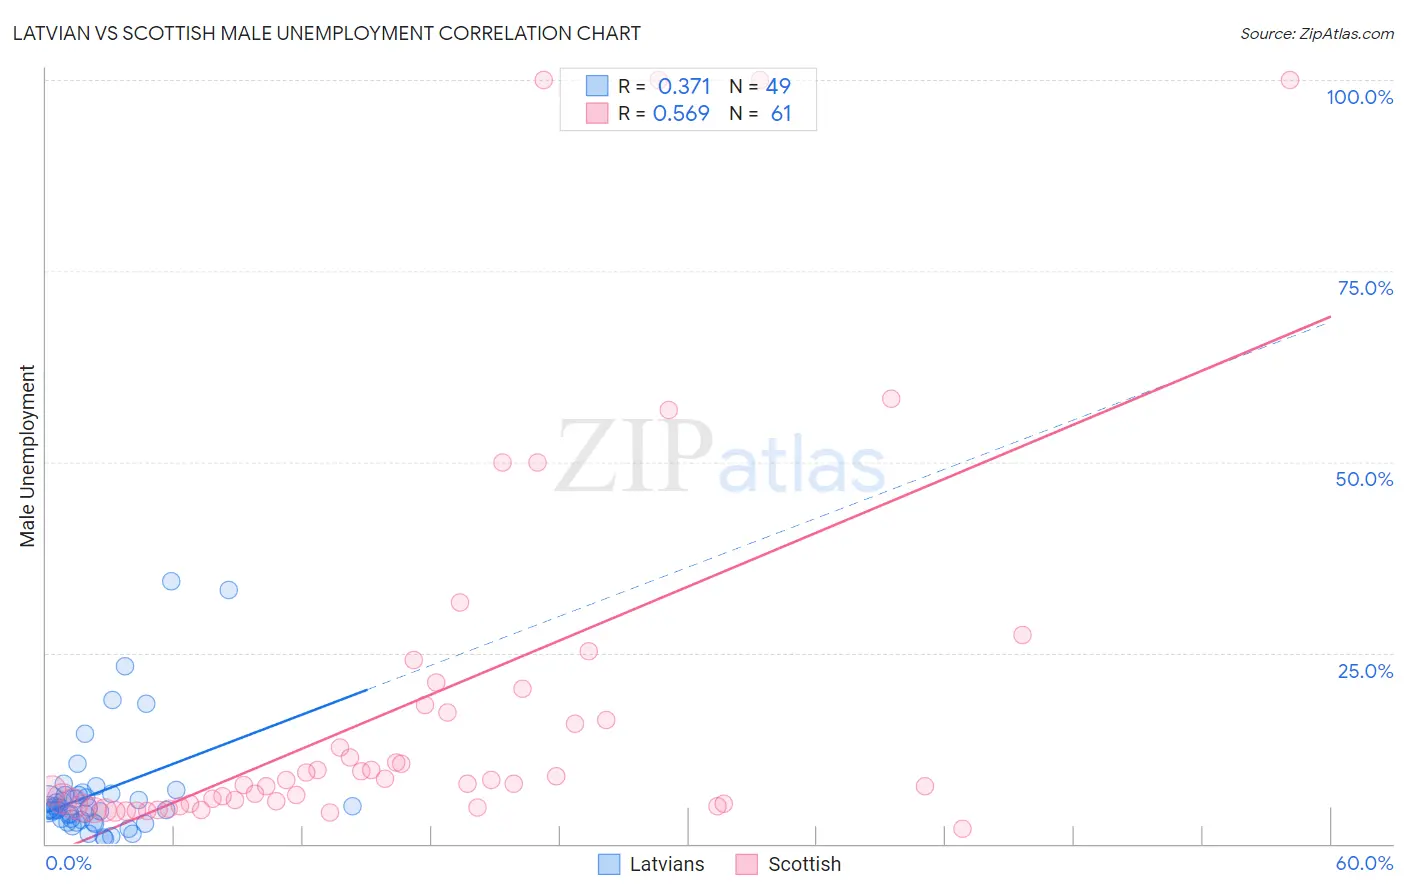
Latvian vs Scottish Male Unemployment Correlation Chart
The statistical analysis conducted on geographies consisting of 220,207,220 people shows a mild positive correlation between the proportion of Latvians and unemployment rate among males in the United States with a correlation coefficient (R) of 0.371 and weighted average of 4.8%. Similarly, the statistical analysis conducted on geographies consisting of 556,190,347 people shows a substantial positive correlation between the proportion of Scottish and unemployment rate among males in the United States with a correlation coefficient (R) of 0.569 and weighted average of 4.8%, a difference of 0.88%.
Male Unemployment Correlation Summary
| Measurement | Latvian | Scottish |
| Minimum | 0.70% | 1.9% |
| Maximum | 34.4% | 100.0% |
| Range | 33.7% | 98.1% |
| Mean | 6.7% | 18.3% |
| Median | 4.7% | 7.9% |
| Interquartile 25% (IQ1) | 3.0% | 5.1% |
| Interquartile 75% (IQ3) | 6.5% | 17.7% |
| Interquartile Range (IQR) | 3.5% | 12.6% |
| Standard Deviation (Sample) | 7.2% | 25.2% |
| Standard Deviation (Population) | 7.2% | 25.0% |
Demographics Similar to Latvians and Scottish by Male Unemployment
In terms of male unemployment, the demographic groups most similar to Latvians are Welsh (4.8%, a difference of 0.080%), Immigrants from Nepal (4.8%, a difference of 0.30%), Sudanese (4.8%, a difference of 0.31%), British (4.8%, a difference of 0.56%), and Paraguayan (4.9%, a difference of 0.93%). Similarly, the demographic groups most similar to Scottish are Bulgarian (4.8%, a difference of 0.13%), British (4.8%, a difference of 0.31%), Belgian (4.8%, a difference of 0.32%), Dutch (4.8%, a difference of 0.52%), and Zimbabwean (4.8%, a difference of 0.54%).
| Demographics | Rating | Rank | Male Unemployment |
| Immigrants | Taiwan | 99.9 /100 | #21 | Exceptional 4.8% |
| Carpatho Rusyns | 99.9 /100 | #22 | Exceptional 4.8% |
| Tongans | 99.9 /100 | #23 | Exceptional 4.8% |
| Immigrants | South Central Asia | 99.9 /100 | #24 | Exceptional 4.8% |
| Zimbabweans | 99.9 /100 | #25 | Exceptional 4.8% |
| Dutch | 99.9 /100 | #26 | Exceptional 4.8% |
| Belgians | 99.9 /100 | #27 | Exceptional 4.8% |
| Bulgarians | 99.8 /100 | #28 | Exceptional 4.8% |
| Scottish | 99.8 /100 | #29 | Exceptional 4.8% |
| British | 99.8 /100 | #30 | Exceptional 4.8% |
| Sudanese | 99.8 /100 | #31 | Exceptional 4.8% |
| Immigrants | Nepal | 99.8 /100 | #32 | Exceptional 4.8% |
| Latvians | 99.7 /100 | #33 | Exceptional 4.8% |
| Welsh | 99.7 /100 | #34 | Exceptional 4.8% |
| Paraguayans | 99.5 /100 | #35 | Exceptional 4.9% |
| Immigrants | Singapore | 99.4 /100 | #36 | Exceptional 4.9% |
| Scotch-Irish | 99.4 /100 | #37 | Exceptional 4.9% |
| Immigrants | Bosnia and Herzegovina | 99.4 /100 | #38 | Exceptional 4.9% |
| Burmese | 99.3 /100 | #39 | Exceptional 4.9% |
| Northern Europeans | 99.3 /100 | #40 | Exceptional 4.9% |
| Chinese | 99.3 /100 | #41 | Exceptional 4.9% |