Latvian vs Immigrants from Taiwan Unemployment
COMPARE
Latvian
Immigrants from Taiwan
Unemployment
Unemployment Comparison
Latvians
Immigrants from Taiwan
4.7%
UNEMPLOYMENT
99.9/ 100
METRIC RATING
25th/ 347
METRIC RANK
4.8%
UNEMPLOYMENT
99.4/ 100
METRIC RATING
47th/ 347
METRIC RANK
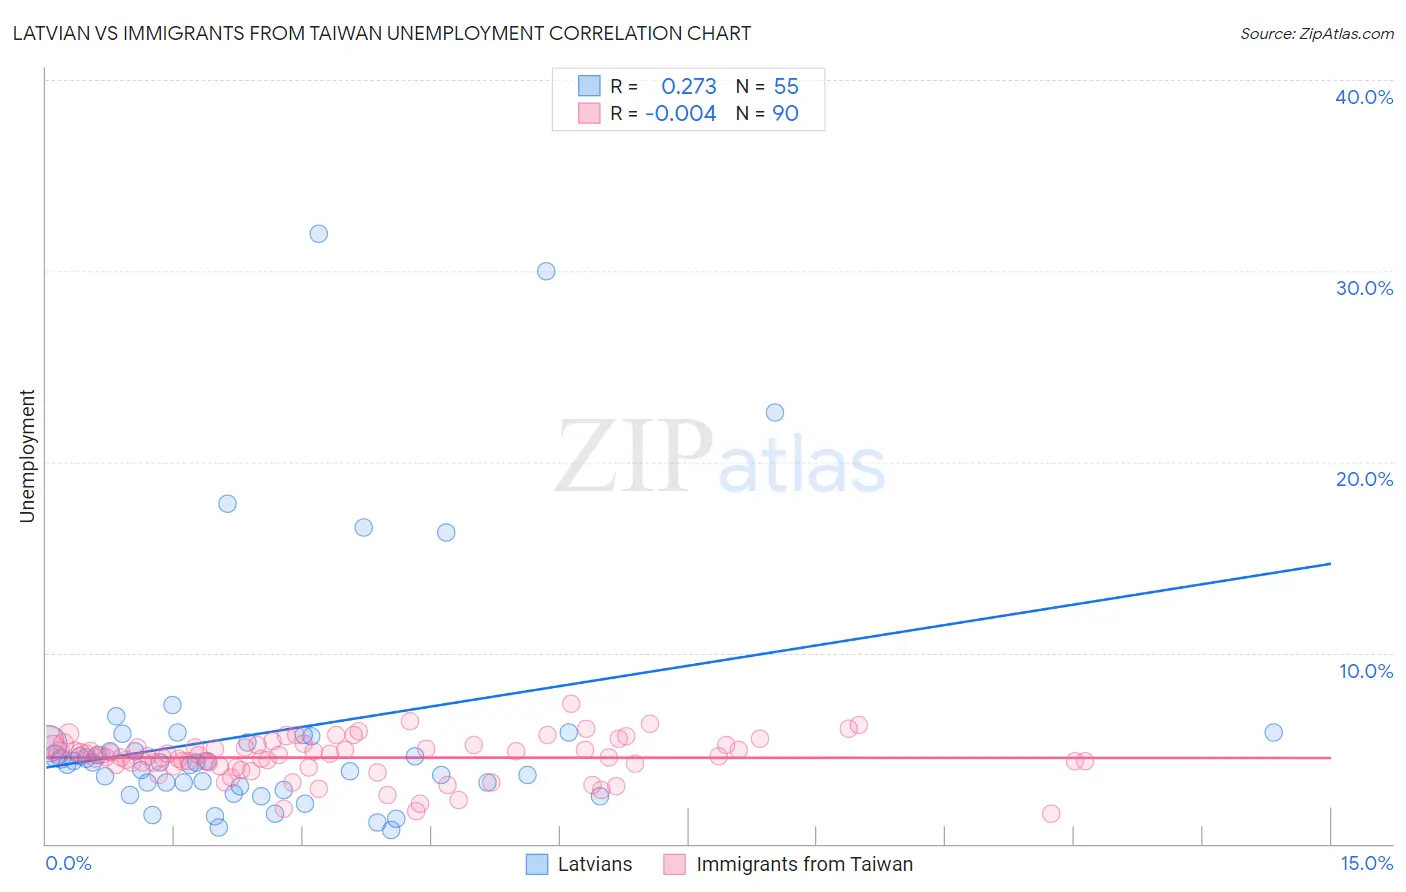
Latvian vs Immigrants from Taiwan Unemployment Correlation Chart
The statistical analysis conducted on geographies consisting of 220,638,236 people shows a weak positive correlation between the proportion of Latvians and unemployment in the United States with a correlation coefficient (R) of 0.273 and weighted average of 4.7%. Similarly, the statistical analysis conducted on geographies consisting of 298,179,834 people shows no correlation between the proportion of Immigrants from Taiwan and unemployment in the United States with a correlation coefficient (R) of -0.004 and weighted average of 4.8%, a difference of 2.9%.
Unemployment Correlation Summary
| Measurement | Latvian | Immigrants from Taiwan |
| Minimum | 0.70% | 1.6% |
| Maximum | 32.0% | 7.3% |
| Range | 31.3% | 5.7% |
| Mean | 5.9% | 4.5% |
| Median | 4.3% | 4.6% |
| Interquartile 25% (IQ1) | 3.0% | 4.1% |
| Interquartile 75% (IQ3) | 5.6% | 5.2% |
| Interquartile Range (IQR) | 2.6% | 1.1% |
| Standard Deviation (Sample) | 6.4% | 1.1% |
| Standard Deviation (Population) | 6.4% | 1.1% |
Similar Demographics by Unemployment
Demographics Similar to Latvians by Unemployment
In terms of unemployment, the demographic groups most similar to Latvians are Bulgarian (4.7%, a difference of 0.040%), Venezuelan (4.7%, a difference of 0.070%), British (4.7%, a difference of 0.15%), Finnish (4.7%, a difference of 0.25%), and Welsh (4.7%, a difference of 0.45%).
| Demographics | Rating | Rank | Unemployment |
| Immigrants | Venezuela | 99.9 /100 | #18 | Exceptional 4.7% |
| Scottish | 99.9 /100 | #19 | Exceptional 4.7% |
| Carpatho Rusyns | 99.9 /100 | #20 | Exceptional 4.7% |
| Welsh | 99.9 /100 | #21 | Exceptional 4.7% |
| Thais | 99.9 /100 | #22 | Exceptional 4.7% |
| British | 99.9 /100 | #23 | Exceptional 4.7% |
| Venezuelans | 99.9 /100 | #24 | Exceptional 4.7% |
| Latvians | 99.9 /100 | #25 | Exceptional 4.7% |
| Bulgarians | 99.9 /100 | #26 | Exceptional 4.7% |
| Finns | 99.9 /100 | #27 | Exceptional 4.7% |
| Cubans | 99.8 /100 | #28 | Exceptional 4.7% |
| Poles | 99.8 /100 | #29 | Exceptional 4.7% |
| Irish | 99.8 /100 | #30 | Exceptional 4.8% |
| Croatians | 99.8 /100 | #31 | Exceptional 4.8% |
| Zimbabweans | 99.8 /100 | #32 | Exceptional 4.8% |
Demographics Similar to Immigrants from Taiwan by Unemployment
In terms of unemployment, the demographic groups most similar to Immigrants from Taiwan are Immigrants from Nepal (4.8%, a difference of 0.020%), French (4.8%, a difference of 0.18%), Immigrants from Scotland (4.9%, a difference of 0.22%), Immigrants from South Central Asia (4.9%, a difference of 0.22%), and Austrian (4.8%, a difference of 0.24%).
| Demographics | Rating | Rank | Unemployment |
| Northern Europeans | 99.7 /100 | #40 | Exceptional 4.8% |
| Immigrants | Bosnia and Herzegovina | 99.7 /100 | #41 | Exceptional 4.8% |
| Filipinos | 99.5 /100 | #42 | Exceptional 4.8% |
| Yugoslavians | 99.5 /100 | #43 | Exceptional 4.8% |
| Austrians | 99.5 /100 | #44 | Exceptional 4.8% |
| French | 99.5 /100 | #45 | Exceptional 4.8% |
| Immigrants | Nepal | 99.4 /100 | #46 | Exceptional 4.8% |
| Immigrants | Taiwan | 99.4 /100 | #47 | Exceptional 4.8% |
| Immigrants | Scotland | 99.3 /100 | #48 | Exceptional 4.9% |
| Immigrants | South Central Asia | 99.3 /100 | #49 | Exceptional 4.9% |
| French Canadians | 99.3 /100 | #50 | Exceptional 4.9% |
| Immigrants | Belgium | 99.2 /100 | #51 | Exceptional 4.9% |
| Whites/Caucasians | 99.2 /100 | #52 | Exceptional 4.9% |
| Immigrants | Zimbabwe | 99.2 /100 | #53 | Exceptional 4.9% |
| Eastern Europeans | 99.2 /100 | #54 | Exceptional 4.9% |