Spanish American vs Immigrants from South Africa Unemployment Among Ages 35 to 44 years
COMPARE
Spanish American
Immigrants from South Africa
Unemployment Among Ages 35 to 44 years
Unemployment Among Ages 35 to 44 years Comparison
Spanish Americans
Immigrants from South Africa
5.3%
UNEMPLOYMENT AMONG AGES 35 TO 44 YEARS
0.1/ 100
METRIC RATING
261st/ 347
METRIC RANK
4.5%
UNEMPLOYMENT AMONG AGES 35 TO 44 YEARS
86.8/ 100
METRIC RATING
121st/ 347
METRIC RANK
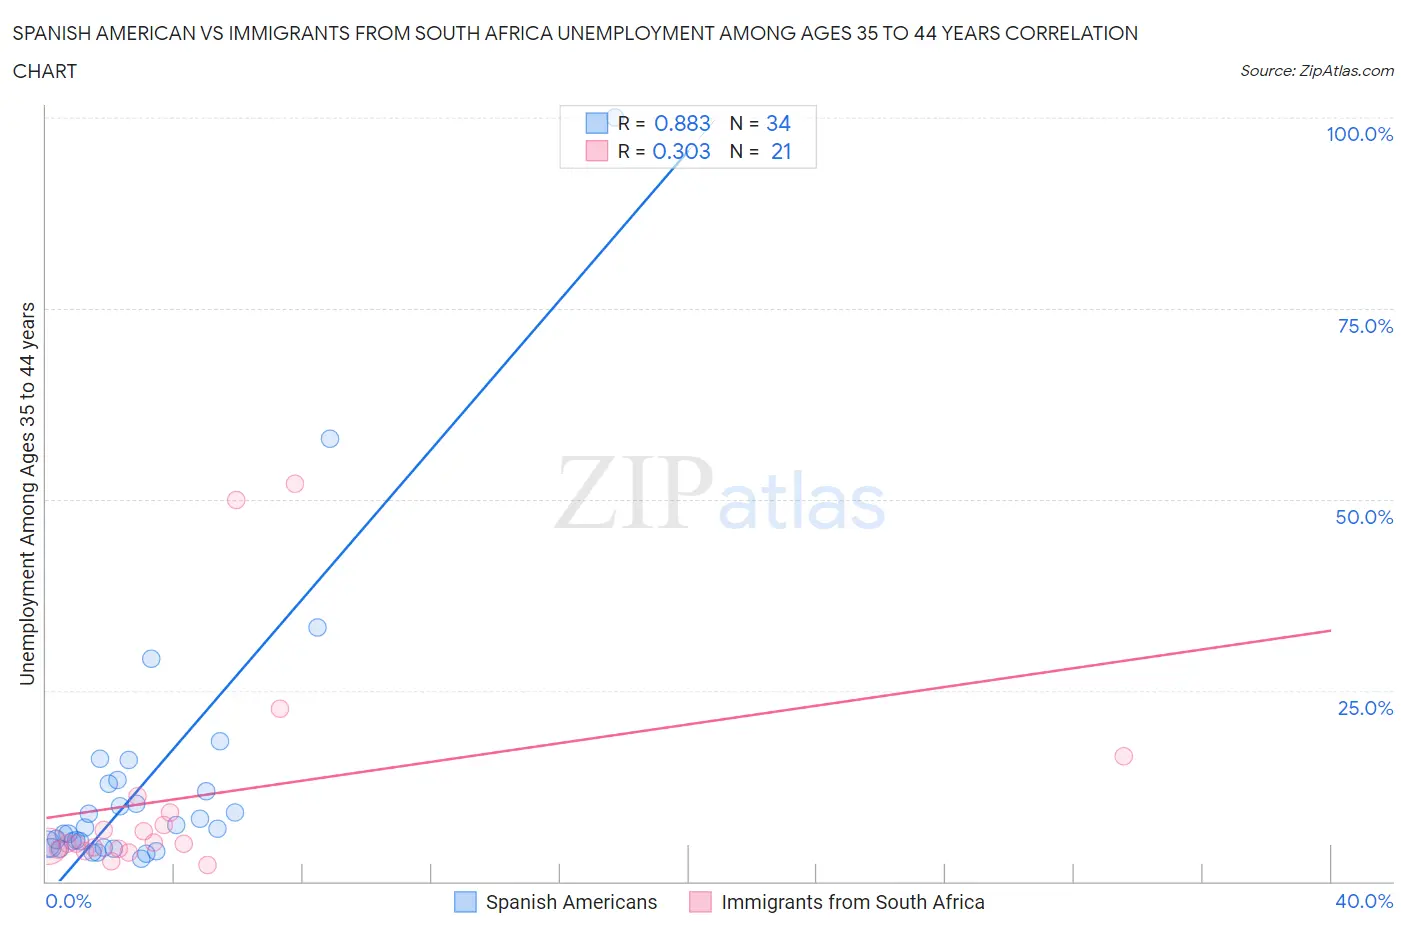
Spanish American vs Immigrants from South Africa Unemployment Among Ages 35 to 44 years Correlation Chart
The statistical analysis conducted on geographies consisting of 102,531,824 people shows a very strong positive correlation between the proportion of Spanish Americans and unemployment rate among population between the ages 35 and 44 in the United States with a correlation coefficient (R) of 0.883 and weighted average of 5.3%. Similarly, the statistical analysis conducted on geographies consisting of 230,101,177 people shows a mild positive correlation between the proportion of Immigrants from South Africa and unemployment rate among population between the ages 35 and 44 in the United States with a correlation coefficient (R) of 0.303 and weighted average of 4.5%, a difference of 16.5%.
Unemployment Among Ages 35 to 44 years Correlation Summary
| Measurement | Spanish American | Immigrants from South Africa |
| Minimum | 2.9% | 2.2% |
| Maximum | 100.0% | 52.1% |
| Range | 97.1% | 49.9% |
| Mean | 13.2% | 11.0% |
| Median | 7.0% | 5.0% |
| Interquartile 25% (IQ1) | 4.5% | 4.2% |
| Interquartile 75% (IQ3) | 12.8% | 10.1% |
| Interquartile Range (IQR) | 8.3% | 5.9% |
| Standard Deviation (Sample) | 18.8% | 14.1% |
| Standard Deviation (Population) | 18.5% | 13.8% |
Similar Demographics by Unemployment Among Ages 35 to 44 years
Demographics Similar to Spanish Americans by Unemployment Among Ages 35 to 44 years
In terms of unemployment among ages 35 to 44 years, the demographic groups most similar to Spanish Americans are Subsaharan African (5.3%, a difference of 0.20%), Mexican (5.3%, a difference of 0.23%), Immigrants from Latin America (5.3%, a difference of 0.33%), Immigrants from Fiji (5.3%, a difference of 0.44%), and Immigrants from Central America (5.3%, a difference of 0.47%).
| Demographics | Rating | Rank | Unemployment Among Ages 35 to 44 years |
| Immigrants | Bahamas | 0.2 /100 | #254 | Tragic 5.2% |
| Cherokee | 0.2 /100 | #255 | Tragic 5.2% |
| Seminole | 0.1 /100 | #256 | Tragic 5.2% |
| Immigrants | Fiji | 0.1 /100 | #257 | Tragic 5.3% |
| Immigrants | Latin America | 0.1 /100 | #258 | Tragic 5.3% |
| Mexicans | 0.1 /100 | #259 | Tragic 5.3% |
| Sub-Saharan Africans | 0.1 /100 | #260 | Tragic 5.3% |
| Spanish Americans | 0.1 /100 | #261 | Tragic 5.3% |
| Immigrants | Central America | 0.1 /100 | #262 | Tragic 5.3% |
| Choctaw | 0.1 /100 | #263 | Tragic 5.3% |
| Ghanaians | 0.1 /100 | #264 | Tragic 5.3% |
| Yaqui | 0.1 /100 | #265 | Tragic 5.3% |
| Immigrants | Bangladesh | 0.1 /100 | #266 | Tragic 5.3% |
| Immigrants | Western Africa | 0.0 /100 | #267 | Tragic 5.3% |
| Hawaiians | 0.0 /100 | #268 | Tragic 5.3% |
Demographics Similar to Immigrants from South Africa by Unemployment Among Ages 35 to 44 years
In terms of unemployment among ages 35 to 44 years, the demographic groups most similar to Immigrants from South Africa are Sri Lankan (4.5%, a difference of 0.0%), Ethiopian (4.5%, a difference of 0.040%), Basque (4.5%, a difference of 0.080%), Nicaraguan (4.5%, a difference of 0.12%), and Immigrants from Spain (4.5%, a difference of 0.12%).
| Demographics | Rating | Rank | Unemployment Among Ages 35 to 44 years |
| Macedonians | 88.3 /100 | #114 | Excellent 4.5% |
| Maltese | 88.1 /100 | #115 | Excellent 4.5% |
| Immigrants | Israel | 88.1 /100 | #116 | Excellent 4.5% |
| Immigrants | Greece | 87.9 /100 | #117 | Excellent 4.5% |
| Irish | 87.9 /100 | #118 | Excellent 4.5% |
| Nicaraguans | 87.6 /100 | #119 | Excellent 4.5% |
| Ethiopians | 87.1 /100 | #120 | Excellent 4.5% |
| Immigrants | South Africa | 86.8 /100 | #121 | Excellent 4.5% |
| Sri Lankans | 86.8 /100 | #122 | Excellent 4.5% |
| Basques | 86.3 /100 | #123 | Excellent 4.5% |
| Immigrants | Spain | 86.1 /100 | #124 | Excellent 4.5% |
| Immigrants | Northern Africa | 86.1 /100 | #125 | Excellent 4.5% |
| Immigrants | Austria | 84.7 /100 | #126 | Excellent 4.5% |
| Immigrants | Ethiopia | 84.7 /100 | #127 | Excellent 4.5% |
| Czechoslovakians | 83.4 /100 | #128 | Excellent 4.6% |