Latvian vs Cape Verdean Unemployment Among Ages 35 to 44 years
COMPARE
Latvian
Cape Verdean
Unemployment Among Ages 35 to 44 years
Unemployment Among Ages 35 to 44 years Comparison
Latvians
Cape Verdeans
4.2%
UNEMPLOYMENT AMONG AGES 35 TO 44 YEARS
99.8/ 100
METRIC RATING
18th/ 347
METRIC RANK
6.6%
UNEMPLOYMENT AMONG AGES 35 TO 44 YEARS
0.0/ 100
METRIC RATING
327th/ 347
METRIC RANK
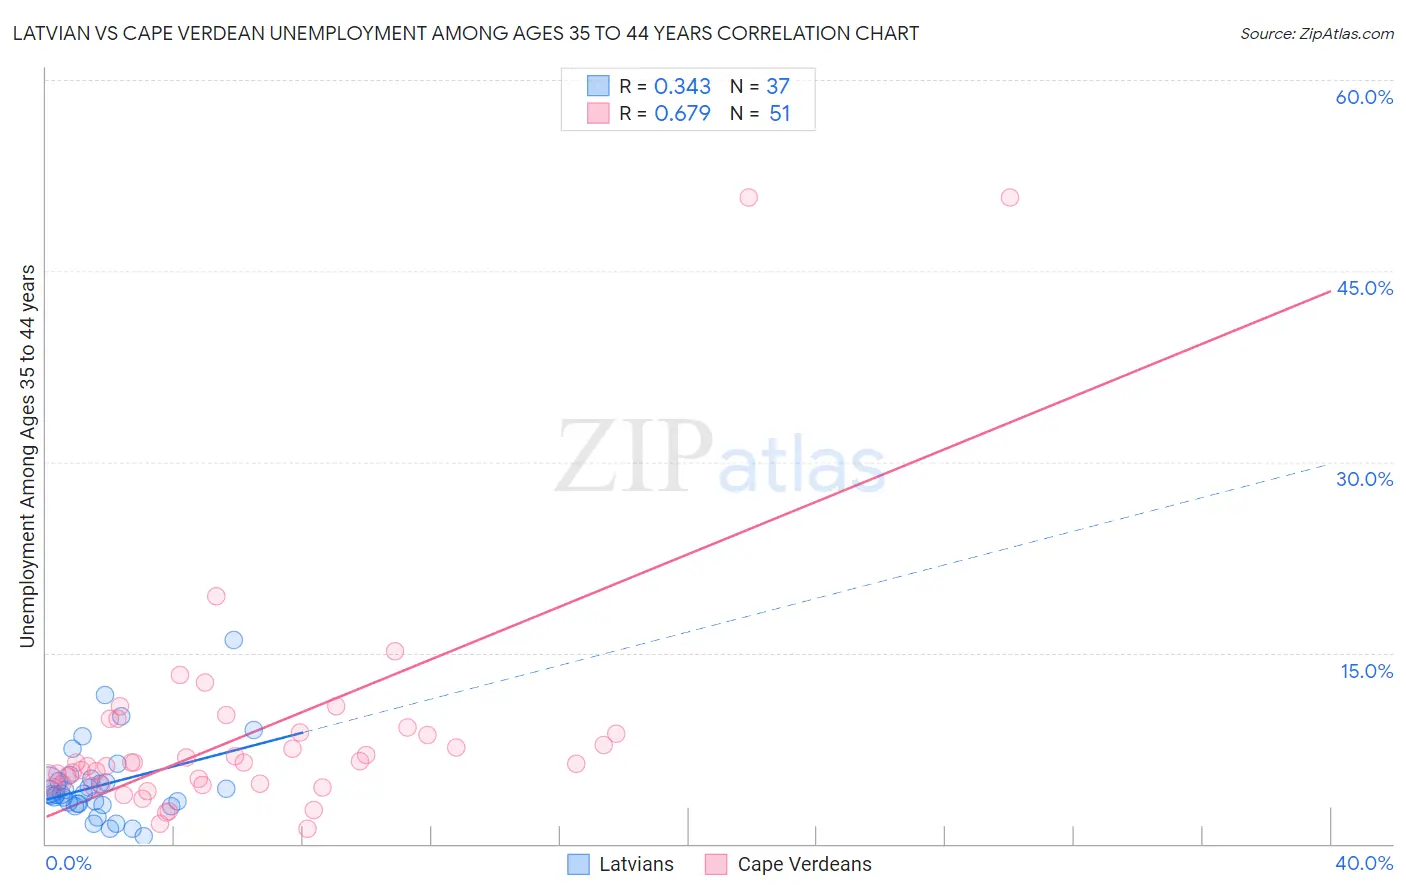
Latvian vs Cape Verdean Unemployment Among Ages 35 to 44 years Correlation Chart
The statistical analysis conducted on geographies consisting of 217,581,244 people shows a mild positive correlation between the proportion of Latvians and unemployment rate among population between the ages 35 and 44 in the United States with a correlation coefficient (R) of 0.343 and weighted average of 4.2%. Similarly, the statistical analysis conducted on geographies consisting of 106,781,435 people shows a significant positive correlation between the proportion of Cape Verdeans and unemployment rate among population between the ages 35 and 44 in the United States with a correlation coefficient (R) of 0.679 and weighted average of 6.6%, a difference of 56.9%.
Unemployment Among Ages 35 to 44 years Correlation Summary
| Measurement | Latvian | Cape Verdean |
| Minimum | 0.60% | 1.2% |
| Maximum | 16.0% | 50.8% |
| Range | 15.4% | 49.6% |
| Mean | 4.6% | 8.5% |
| Median | 3.9% | 6.4% |
| Interquartile 25% (IQ1) | 3.1% | 4.6% |
| Interquartile 75% (IQ3) | 5.0% | 8.7% |
| Interquartile Range (IQR) | 1.9% | 4.1% |
| Standard Deviation (Sample) | 3.1% | 9.3% |
| Standard Deviation (Population) | 3.0% | 9.2% |
Similar Demographics by Unemployment Among Ages 35 to 44 years
Demographics Similar to Latvians by Unemployment Among Ages 35 to 44 years
In terms of unemployment among ages 35 to 44 years, the demographic groups most similar to Latvians are Swedish (4.2%, a difference of 0.010%), Cuban (4.2%, a difference of 0.020%), Immigrants from Nepal (4.2%, a difference of 0.27%), Immigrants from Bolivia (4.2%, a difference of 0.52%), and Tongan (4.2%, a difference of 0.79%).
| Demographics | Rating | Rank | Unemployment Among Ages 35 to 44 years |
| Sudanese | 99.9 /100 | #11 | Exceptional 4.1% |
| Venezuelans | 99.9 /100 | #12 | Exceptional 4.1% |
| Bolivians | 99.9 /100 | #13 | Exceptional 4.1% |
| Czechs | 99.9 /100 | #14 | Exceptional 4.1% |
| Tongans | 99.8 /100 | #15 | Exceptional 4.2% |
| Cubans | 99.8 /100 | #16 | Exceptional 4.2% |
| Swedes | 99.8 /100 | #17 | Exceptional 4.2% |
| Latvians | 99.8 /100 | #18 | Exceptional 4.2% |
| Immigrants | Nepal | 99.7 /100 | #19 | Exceptional 4.2% |
| Immigrants | Bolivia | 99.7 /100 | #20 | Exceptional 4.2% |
| Paraguayans | 99.6 /100 | #21 | Exceptional 4.2% |
| Scandinavians | 99.5 /100 | #22 | Exceptional 4.2% |
| Immigrants | Kuwait | 99.5 /100 | #23 | Exceptional 4.3% |
| Tlingit-Haida | 99.5 /100 | #24 | Exceptional 4.3% |
| Bulgarians | 99.3 /100 | #25 | Exceptional 4.3% |
Demographics Similar to Cape Verdeans by Unemployment Among Ages 35 to 44 years
In terms of unemployment among ages 35 to 44 years, the demographic groups most similar to Cape Verdeans are Alaska Native (6.6%, a difference of 0.050%), Immigrants from Yemen (6.6%, a difference of 0.12%), Menominee (6.5%, a difference of 0.47%), Shoshone (6.6%, a difference of 0.69%), and Dominican (6.4%, a difference of 2.1%).
| Demographics | Rating | Rank | Unemployment Among Ages 35 to 44 years |
| Immigrants | Armenia | 0.0 /100 | #320 | Tragic 6.2% |
| Chippewa | 0.0 /100 | #321 | Tragic 6.2% |
| Immigrants | Dominican Republic | 0.0 /100 | #322 | Tragic 6.4% |
| Dominicans | 0.0 /100 | #323 | Tragic 6.4% |
| Menominee | 0.0 /100 | #324 | Tragic 6.5% |
| Immigrants | Yemen | 0.0 /100 | #325 | Tragic 6.6% |
| Alaska Natives | 0.0 /100 | #326 | Tragic 6.6% |
| Cape Verdeans | 0.0 /100 | #327 | Tragic 6.6% |
| Shoshone | 0.0 /100 | #328 | Tragic 6.6% |
| Paiute | 0.0 /100 | #329 | Tragic 6.9% |
| Immigrants | Cabo Verde | 0.0 /100 | #330 | Tragic 6.9% |
| Pueblo | 0.0 /100 | #331 | Tragic 7.1% |
| Natives/Alaskans | 0.0 /100 | #332 | Tragic 7.3% |
| Puerto Ricans | 0.0 /100 | #333 | Tragic 7.6% |
| Houma | 0.0 /100 | #334 | Tragic 7.8% |