Immigrants from Nigeria vs French Canadian Unemployment Among Ages 65 to 74 years
COMPARE
Immigrants from Nigeria
French Canadian
Unemployment Among Ages 65 to 74 years
Unemployment Among Ages 65 to 74 years Comparison
Immigrants from Nigeria
French Canadians
5.7%
UNEMPLOYMENT AMONG AGES 65 TO 74 YEARS
0.1/ 100
METRIC RATING
270th/ 347
METRIC RANK
5.6%
UNEMPLOYMENT AMONG AGES 65 TO 74 YEARS
0.2/ 100
METRIC RATING
266th/ 347
METRIC RANK
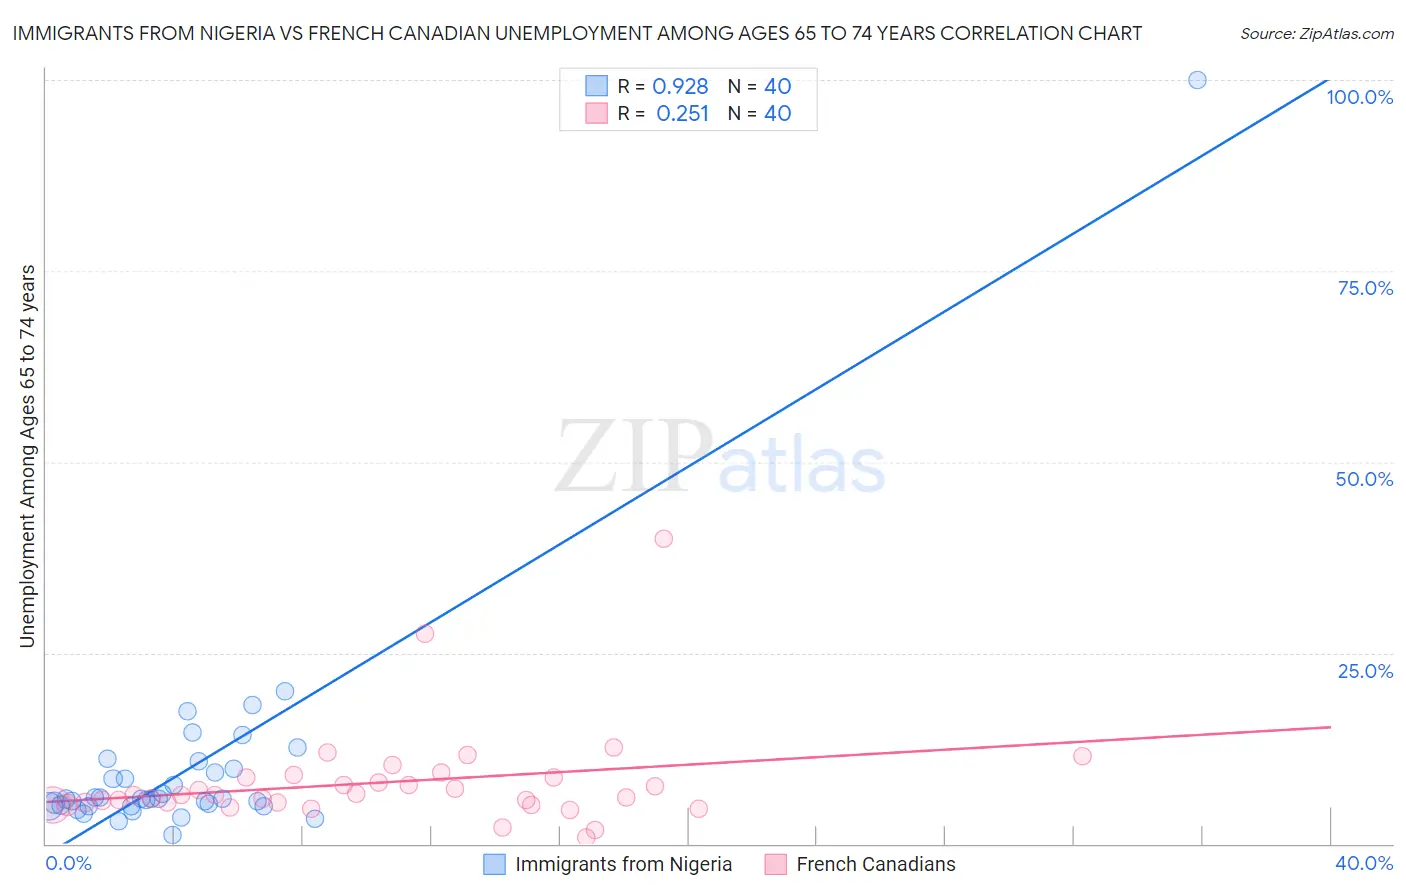
Immigrants from Nigeria vs French Canadian Unemployment Among Ages 65 to 74 years Correlation Chart
The statistical analysis conducted on geographies consisting of 261,086,383 people shows a near-perfect positive correlation between the proportion of Immigrants from Nigeria and unemployment rate among population between the ages 65 and 74 in the United States with a correlation coefficient (R) of 0.928 and weighted average of 5.7%. Similarly, the statistical analysis conducted on geographies consisting of 412,409,356 people shows a weak positive correlation between the proportion of French Canadians and unemployment rate among population between the ages 65 and 74 in the United States with a correlation coefficient (R) of 0.251 and weighted average of 5.6%, a difference of 0.15%.
Unemployment Among Ages 65 to 74 years Correlation Summary
| Measurement | Immigrants from Nigeria | French Canadian |
| Minimum | 1.2% | 0.90% |
| Maximum | 100.0% | 40.0% |
| Range | 98.8% | 39.1% |
| Mean | 9.8% | 8.0% |
| Median | 5.9% | 6.3% |
| Interquartile 25% (IQ1) | 5.0% | 5.2% |
| Interquartile 75% (IQ3) | 9.5% | 8.7% |
| Interquartile Range (IQR) | 4.6% | 3.4% |
| Standard Deviation (Sample) | 15.2% | 6.7% |
| Standard Deviation (Population) | 15.1% | 6.6% |
Demographics Similar to Immigrants from Nigeria and French Canadians by Unemployment Among Ages 65 to 74 years
In terms of unemployment among ages 65 to 74 years, the demographic groups most similar to Immigrants from Nigeria are Immigrants from Colombia (5.7%, a difference of 0.030%), Belizean (5.7%, a difference of 0.030%), Yaqui (5.7%, a difference of 0.050%), Bahamian (5.7%, a difference of 0.070%), and Immigrants from Guyana (5.7%, a difference of 0.090%). Similarly, the demographic groups most similar to French Canadians are Guyanese (5.6%, a difference of 0.010%), Jamaican (5.6%, a difference of 0.040%), Hawaiian (5.7%, a difference of 0.050%), Pueblo (5.6%, a difference of 0.080%), and Immigrants from Jamaica (5.6%, a difference of 0.090%).
| Demographics | Rating | Rank | Unemployment Among Ages 65 to 74 years |
| Immigrants | Western Africa | 0.3 /100 | #258 | Tragic 5.6% |
| Sierra Leoneans | 0.2 /100 | #259 | Tragic 5.6% |
| Immigrants | Barbados | 0.2 /100 | #260 | Tragic 5.6% |
| South Americans | 0.2 /100 | #261 | Tragic 5.6% |
| Immigrants | St. Vincent and the Grenadines | 0.2 /100 | #262 | Tragic 5.6% |
| Immigrants | Jamaica | 0.2 /100 | #263 | Tragic 5.6% |
| Pueblo | 0.2 /100 | #264 | Tragic 5.6% |
| Jamaicans | 0.2 /100 | #265 | Tragic 5.6% |
| French Canadians | 0.2 /100 | #266 | Tragic 5.6% |
| Guyanese | 0.2 /100 | #267 | Tragic 5.6% |
| Hawaiians | 0.2 /100 | #268 | Tragic 5.7% |
| Immigrants | Colombia | 0.1 /100 | #269 | Tragic 5.7% |
| Immigrants | Nigeria | 0.1 /100 | #270 | Tragic 5.7% |
| Belizeans | 0.1 /100 | #271 | Tragic 5.7% |
| Yaqui | 0.1 /100 | #272 | Tragic 5.7% |
| Bahamians | 0.1 /100 | #273 | Tragic 5.7% |
| Immigrants | Guyana | 0.1 /100 | #274 | Tragic 5.7% |
| Immigrants | Liberia | 0.1 /100 | #275 | Tragic 5.7% |
| Somalis | 0.1 /100 | #276 | Tragic 5.7% |
| Immigrants | South America | 0.1 /100 | #277 | Tragic 5.7% |
| Mexican American Indians | 0.1 /100 | #278 | Tragic 5.7% |