Cambodian vs French Canadian Unemployment Among Ages 65 to 74 years
COMPARE
Cambodian
French Canadian
Unemployment Among Ages 65 to 74 years
Unemployment Among Ages 65 to 74 years Comparison
Cambodians
French Canadians
5.0%
UNEMPLOYMENT AMONG AGES 65 TO 74 YEARS
100.0/ 100
METRIC RATING
34th/ 347
METRIC RANK
5.6%
UNEMPLOYMENT AMONG AGES 65 TO 74 YEARS
0.2/ 100
METRIC RATING
266th/ 347
METRIC RANK
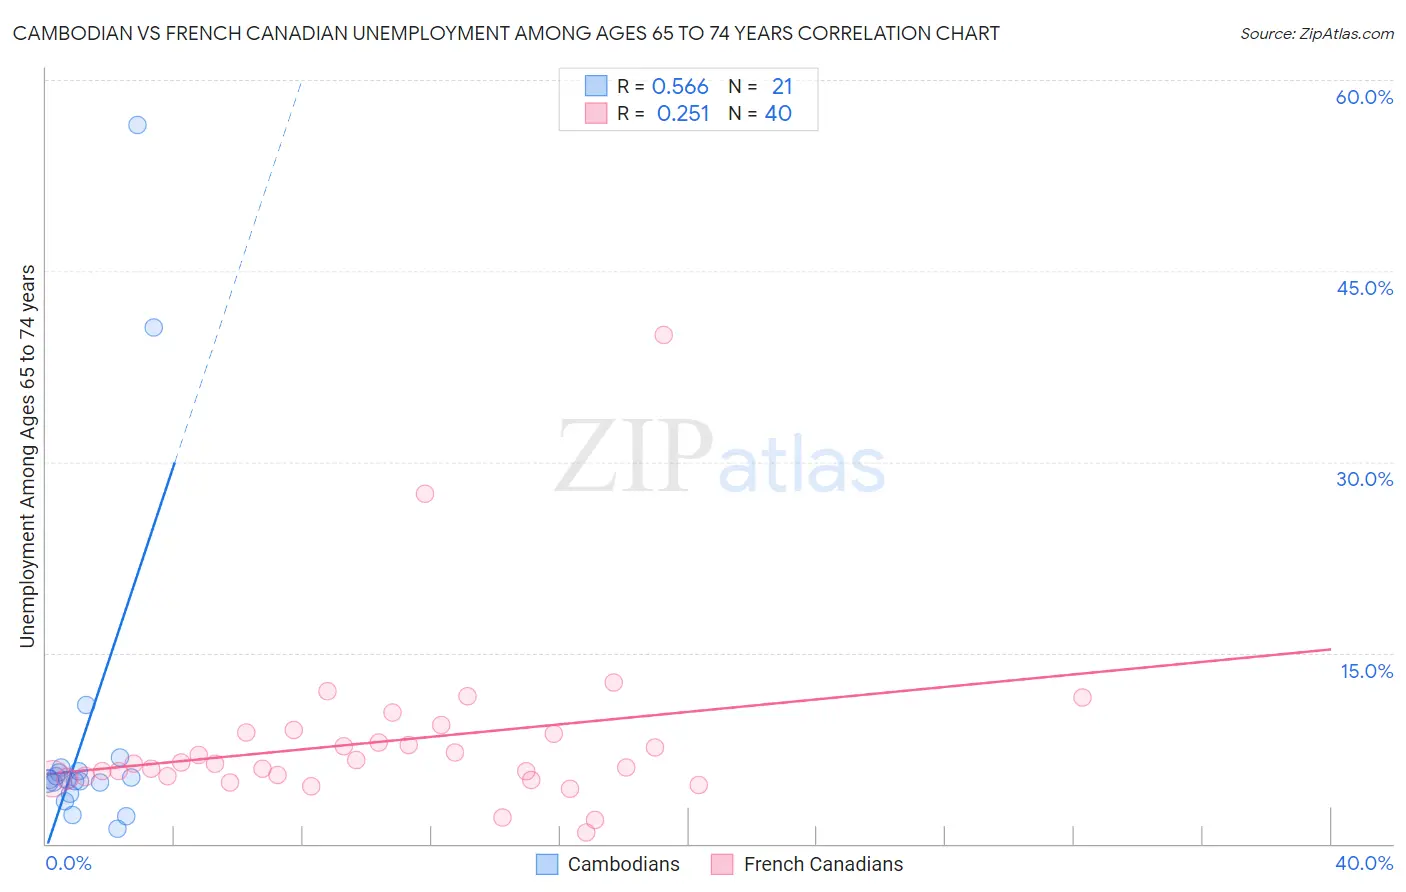
Cambodian vs French Canadian Unemployment Among Ages 65 to 74 years Correlation Chart
The statistical analysis conducted on geographies consisting of 98,775,189 people shows a substantial positive correlation between the proportion of Cambodians and unemployment rate among population between the ages 65 and 74 in the United States with a correlation coefficient (R) of 0.566 and weighted average of 5.0%. Similarly, the statistical analysis conducted on geographies consisting of 412,409,356 people shows a weak positive correlation between the proportion of French Canadians and unemployment rate among population between the ages 65 and 74 in the United States with a correlation coefficient (R) of 0.251 and weighted average of 5.6%, a difference of 12.6%.
Unemployment Among Ages 65 to 74 years Correlation Summary
| Measurement | Cambodian | French Canadian |
| Minimum | 1.2% | 0.90% |
| Maximum | 56.5% | 40.0% |
| Range | 55.3% | 39.1% |
| Mean | 9.1% | 8.0% |
| Median | 5.0% | 6.3% |
| Interquartile 25% (IQ1) | 4.4% | 5.2% |
| Interquartile 75% (IQ3) | 5.8% | 8.7% |
| Interquartile Range (IQR) | 1.5% | 3.4% |
| Standard Deviation (Sample) | 13.5% | 6.7% |
| Standard Deviation (Population) | 13.2% | 6.6% |
Similar Demographics by Unemployment Among Ages 65 to 74 years
Demographics Similar to Cambodians by Unemployment Among Ages 65 to 74 years
In terms of unemployment among ages 65 to 74 years, the demographic groups most similar to Cambodians are Belgian (5.0%, a difference of 0.0%), Palestinian (5.0%, a difference of 0.060%), Bhutanese (5.0%, a difference of 0.11%), Immigrants from Kuwait (5.0%, a difference of 0.30%), and Immigrants from Eastern Africa (5.0%, a difference of 0.31%).
| Demographics | Rating | Rank | Unemployment Among Ages 65 to 74 years |
| Norwegians | 100.0 /100 | #27 | Exceptional 5.0% |
| Bulgarians | 100.0 /100 | #28 | Exceptional 5.0% |
| Ethiopians | 100.0 /100 | #29 | Exceptional 5.0% |
| Immigrants | Lebanon | 100.0 /100 | #30 | Exceptional 5.0% |
| Slovenes | 100.0 /100 | #31 | Exceptional 5.0% |
| Palestinians | 100.0 /100 | #32 | Exceptional 5.0% |
| Belgians | 100.0 /100 | #33 | Exceptional 5.0% |
| Cambodians | 100.0 /100 | #34 | Exceptional 5.0% |
| Bhutanese | 100.0 /100 | #35 | Exceptional 5.0% |
| Immigrants | Kuwait | 99.9 /100 | #36 | Exceptional 5.0% |
| Immigrants | Eastern Africa | 99.9 /100 | #37 | Exceptional 5.0% |
| Nepalese | 99.9 /100 | #38 | Exceptional 5.0% |
| Immigrants | Sweden | 99.9 /100 | #39 | Exceptional 5.0% |
| Immigrants | Iraq | 99.9 /100 | #40 | Exceptional 5.1% |
| Ugandans | 99.9 /100 | #41 | Exceptional 5.1% |
Demographics Similar to French Canadians by Unemployment Among Ages 65 to 74 years
In terms of unemployment among ages 65 to 74 years, the demographic groups most similar to French Canadians are Guyanese (5.6%, a difference of 0.010%), Jamaican (5.6%, a difference of 0.040%), Hawaiian (5.7%, a difference of 0.050%), Pueblo (5.6%, a difference of 0.080%), and Immigrants from Jamaica (5.6%, a difference of 0.090%).
| Demographics | Rating | Rank | Unemployment Among Ages 65 to 74 years |
| Sierra Leoneans | 0.2 /100 | #259 | Tragic 5.6% |
| Immigrants | Barbados | 0.2 /100 | #260 | Tragic 5.6% |
| South Americans | 0.2 /100 | #261 | Tragic 5.6% |
| Immigrants | St. Vincent and the Grenadines | 0.2 /100 | #262 | Tragic 5.6% |
| Immigrants | Jamaica | 0.2 /100 | #263 | Tragic 5.6% |
| Pueblo | 0.2 /100 | #264 | Tragic 5.6% |
| Jamaicans | 0.2 /100 | #265 | Tragic 5.6% |
| French Canadians | 0.2 /100 | #266 | Tragic 5.6% |
| Guyanese | 0.2 /100 | #267 | Tragic 5.6% |
| Hawaiians | 0.2 /100 | #268 | Tragic 5.7% |
| Immigrants | Colombia | 0.1 /100 | #269 | Tragic 5.7% |
| Immigrants | Nigeria | 0.1 /100 | #270 | Tragic 5.7% |
| Belizeans | 0.1 /100 | #271 | Tragic 5.7% |
| Yaqui | 0.1 /100 | #272 | Tragic 5.7% |
| Bahamians | 0.1 /100 | #273 | Tragic 5.7% |