Immigrants from Panama vs French Canadian Unemployment Among Ages 65 to 74 years
COMPARE
Immigrants from Panama
French Canadian
Unemployment Among Ages 65 to 74 years
Unemployment Among Ages 65 to 74 years Comparison
Immigrants from Panama
French Canadians
5.3%
UNEMPLOYMENT AMONG AGES 65 TO 74 YEARS
81.8/ 100
METRIC RATING
134th/ 347
METRIC RANK
5.6%
UNEMPLOYMENT AMONG AGES 65 TO 74 YEARS
0.2/ 100
METRIC RATING
266th/ 347
METRIC RANK
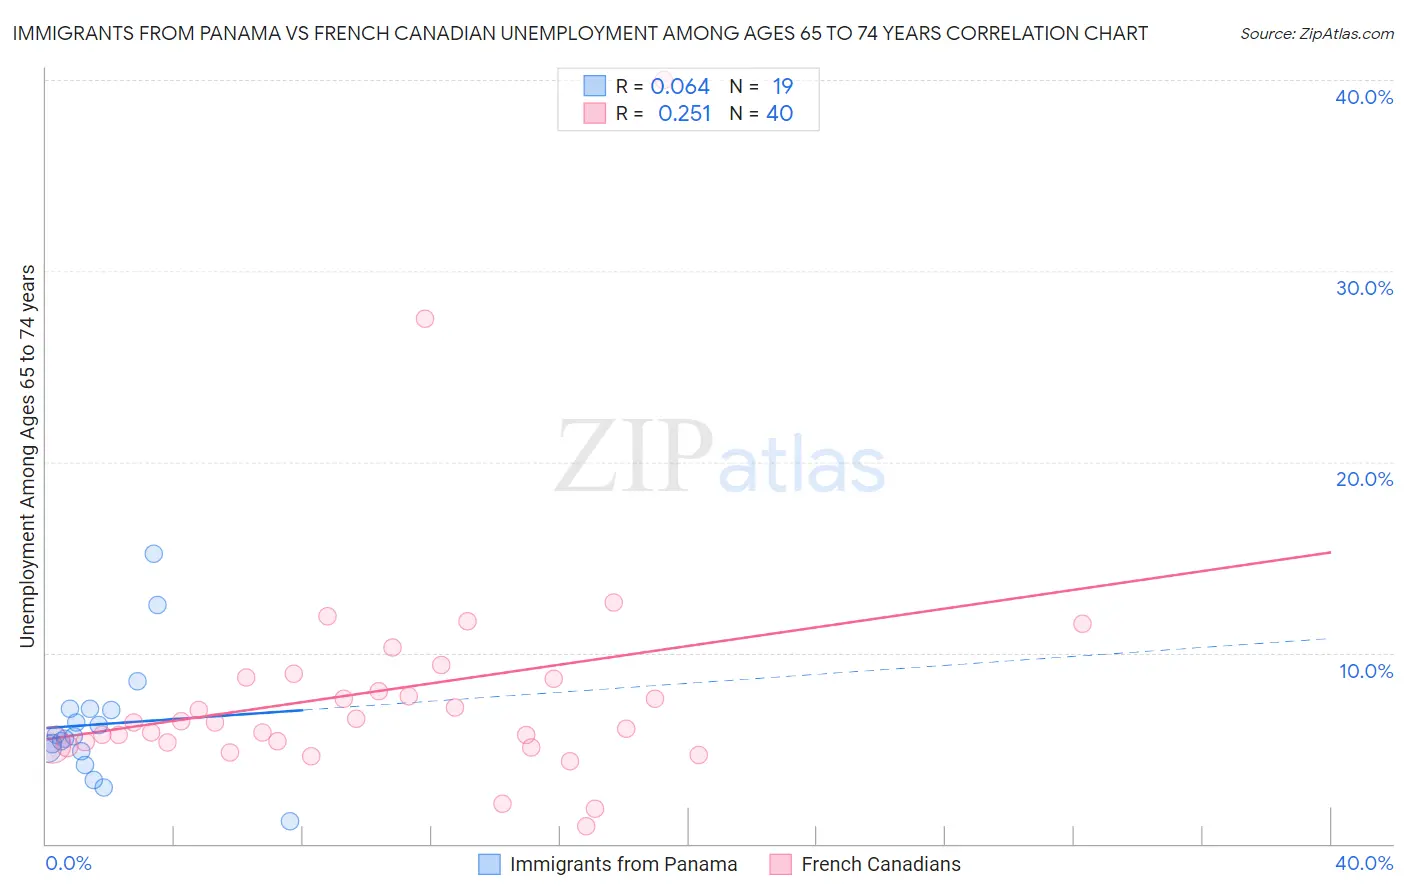
Immigrants from Panama vs French Canadian Unemployment Among Ages 65 to 74 years Correlation Chart
The statistical analysis conducted on geographies consisting of 205,384,024 people shows a slight positive correlation between the proportion of Immigrants from Panama and unemployment rate among population between the ages 65 and 74 in the United States with a correlation coefficient (R) of 0.064 and weighted average of 5.3%. Similarly, the statistical analysis conducted on geographies consisting of 412,409,356 people shows a weak positive correlation between the proportion of French Canadians and unemployment rate among population between the ages 65 and 74 in the United States with a correlation coefficient (R) of 0.251 and weighted average of 5.6%, a difference of 6.6%.
Unemployment Among Ages 65 to 74 years Correlation Summary
| Measurement | Immigrants from Panama | French Canadian |
| Minimum | 1.2% | 0.90% |
| Maximum | 15.2% | 40.0% |
| Range | 14.0% | 39.1% |
| Mean | 6.3% | 8.0% |
| Median | 5.6% | 6.3% |
| Interquartile 25% (IQ1) | 4.9% | 5.2% |
| Interquartile 75% (IQ3) | 7.1% | 8.7% |
| Interquartile Range (IQR) | 2.2% | 3.4% |
| Standard Deviation (Sample) | 3.2% | 6.7% |
| Standard Deviation (Population) | 3.1% | 6.6% |
Similar Demographics by Unemployment Among Ages 65 to 74 years
Demographics Similar to Immigrants from Panama by Unemployment Among Ages 65 to 74 years
In terms of unemployment among ages 65 to 74 years, the demographic groups most similar to Immigrants from Panama are Immigrants from Serbia (5.3%, a difference of 0.0%), Ukrainian (5.3%, a difference of 0.010%), Korean (5.3%, a difference of 0.040%), Celtic (5.3%, a difference of 0.060%), and Immigrants from Afghanistan (5.3%, a difference of 0.060%).
| Demographics | Rating | Rank | Unemployment Among Ages 65 to 74 years |
| Immigrants | North America | 86.7 /100 | #127 | Excellent 5.3% |
| Immigrants | Hong Kong | 86.5 /100 | #128 | Excellent 5.3% |
| Immigrants | England | 86.2 /100 | #129 | Excellent 5.3% |
| Eastern Europeans | 85.6 /100 | #130 | Excellent 5.3% |
| Immigrants | Russia | 83.0 /100 | #131 | Excellent 5.3% |
| Koreans | 82.6 /100 | #132 | Excellent 5.3% |
| Ukrainians | 82.0 /100 | #133 | Excellent 5.3% |
| Immigrants | Panama | 81.8 /100 | #134 | Excellent 5.3% |
| Immigrants | Serbia | 81.8 /100 | #135 | Excellent 5.3% |
| Celtics | 80.8 /100 | #136 | Excellent 5.3% |
| Immigrants | Afghanistan | 80.8 /100 | #137 | Excellent 5.3% |
| Chileans | 79.7 /100 | #138 | Good 5.3% |
| Finns | 79.0 /100 | #139 | Good 5.3% |
| Immigrants | Laos | 78.6 /100 | #140 | Good 5.3% |
| Immigrants | Asia | 78.4 /100 | #141 | Good 5.3% |
Demographics Similar to French Canadians by Unemployment Among Ages 65 to 74 years
In terms of unemployment among ages 65 to 74 years, the demographic groups most similar to French Canadians are Guyanese (5.6%, a difference of 0.010%), Jamaican (5.6%, a difference of 0.040%), Hawaiian (5.7%, a difference of 0.050%), Pueblo (5.6%, a difference of 0.080%), and Immigrants from Jamaica (5.6%, a difference of 0.090%).
| Demographics | Rating | Rank | Unemployment Among Ages 65 to 74 years |
| Sierra Leoneans | 0.2 /100 | #259 | Tragic 5.6% |
| Immigrants | Barbados | 0.2 /100 | #260 | Tragic 5.6% |
| South Americans | 0.2 /100 | #261 | Tragic 5.6% |
| Immigrants | St. Vincent and the Grenadines | 0.2 /100 | #262 | Tragic 5.6% |
| Immigrants | Jamaica | 0.2 /100 | #263 | Tragic 5.6% |
| Pueblo | 0.2 /100 | #264 | Tragic 5.6% |
| Jamaicans | 0.2 /100 | #265 | Tragic 5.6% |
| French Canadians | 0.2 /100 | #266 | Tragic 5.6% |
| Guyanese | 0.2 /100 | #267 | Tragic 5.6% |
| Hawaiians | 0.2 /100 | #268 | Tragic 5.7% |
| Immigrants | Colombia | 0.1 /100 | #269 | Tragic 5.7% |
| Immigrants | Nigeria | 0.1 /100 | #270 | Tragic 5.7% |
| Belizeans | 0.1 /100 | #271 | Tragic 5.7% |
| Yaqui | 0.1 /100 | #272 | Tragic 5.7% |
| Bahamians | 0.1 /100 | #273 | Tragic 5.7% |