Immigrants from Honduras vs Cape Verdean Unemployment Among Ages 35 to 44 years
COMPARE
Immigrants from Honduras
Cape Verdean
Unemployment Among Ages 35 to 44 years
Unemployment Among Ages 35 to 44 years Comparison
Immigrants from Honduras
Cape Verdeans
5.1%
UNEMPLOYMENT AMONG AGES 35 TO 44 YEARS
0.6/ 100
METRIC RATING
241st/ 347
METRIC RANK
6.6%
UNEMPLOYMENT AMONG AGES 35 TO 44 YEARS
0.0/ 100
METRIC RATING
327th/ 347
METRIC RANK
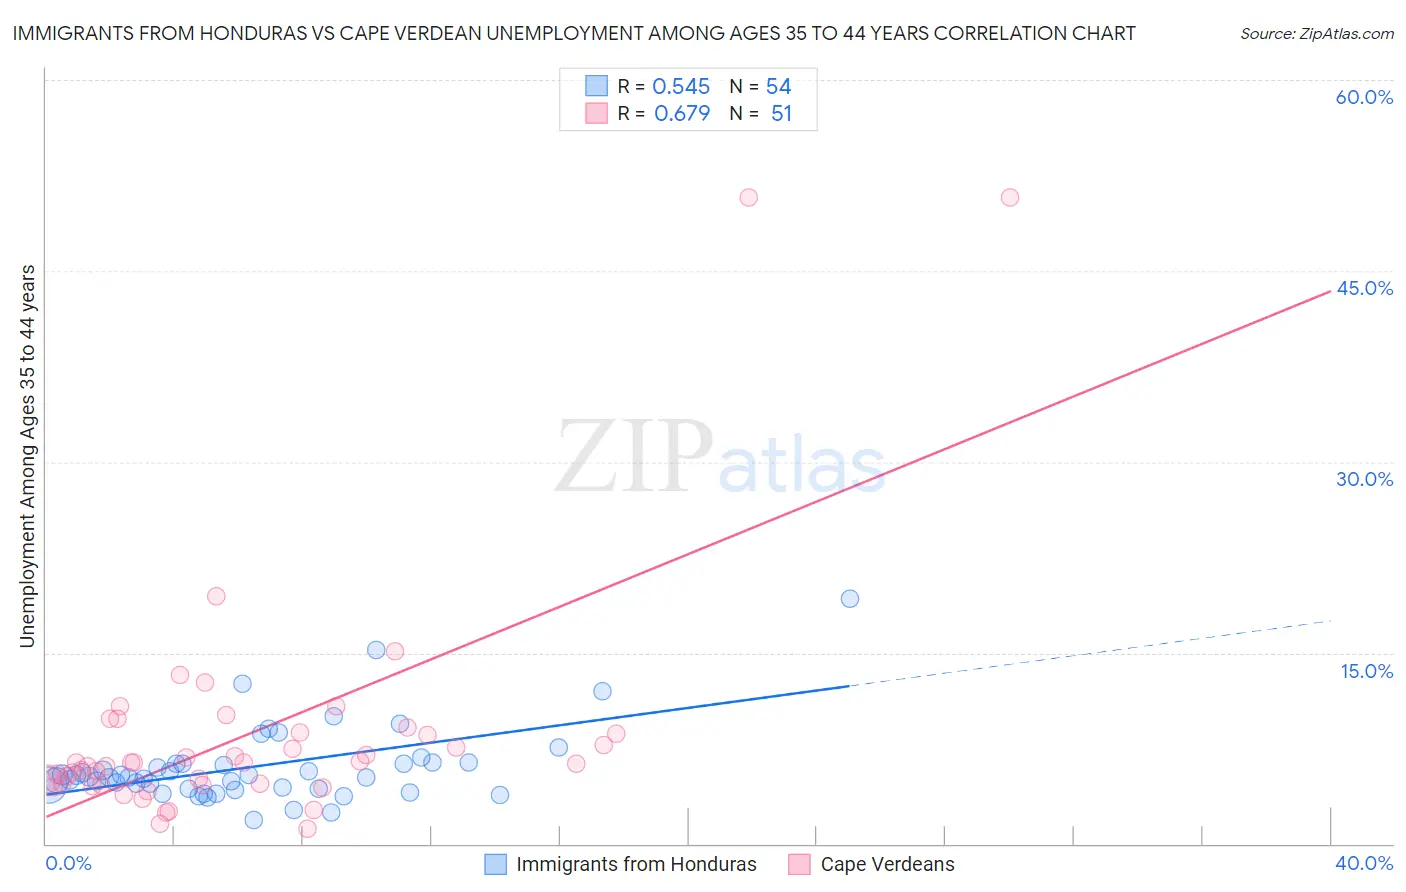
Immigrants from Honduras vs Cape Verdean Unemployment Among Ages 35 to 44 years Correlation Chart
The statistical analysis conducted on geographies consisting of 317,592,724 people shows a substantial positive correlation between the proportion of Immigrants from Honduras and unemployment rate among population between the ages 35 and 44 in the United States with a correlation coefficient (R) of 0.545 and weighted average of 5.1%. Similarly, the statistical analysis conducted on geographies consisting of 106,781,435 people shows a significant positive correlation between the proportion of Cape Verdeans and unemployment rate among population between the ages 35 and 44 in the United States with a correlation coefficient (R) of 0.679 and weighted average of 6.6%, a difference of 28.2%.
Unemployment Among Ages 35 to 44 years Correlation Summary
| Measurement | Immigrants from Honduras | Cape Verdean |
| Minimum | 1.9% | 1.2% |
| Maximum | 19.2% | 50.8% |
| Range | 17.3% | 49.6% |
| Mean | 6.1% | 8.5% |
| Median | 5.3% | 6.4% |
| Interquartile 25% (IQ1) | 4.4% | 4.6% |
| Interquartile 75% (IQ3) | 6.3% | 8.7% |
| Interquartile Range (IQR) | 1.9% | 4.1% |
| Standard Deviation (Sample) | 3.1% | 9.3% |
| Standard Deviation (Population) | 3.0% | 9.2% |
Similar Demographics by Unemployment Among Ages 35 to 44 years
Demographics Similar to Immigrants from Honduras by Unemployment Among Ages 35 to 44 years
In terms of unemployment among ages 35 to 44 years, the demographic groups most similar to Immigrants from Honduras are Somali (5.1%, a difference of 0.18%), Nigerian (5.1%, a difference of 0.31%), Honduran (5.1%, a difference of 0.37%), Delaware (5.1%, a difference of 0.37%), and Salvadoran (5.1%, a difference of 0.49%).
| Demographics | Rating | Rank | Unemployment Among Ages 35 to 44 years |
| Portuguese | 1.1 /100 | #234 | Tragic 5.1% |
| Guamanians/Chamorros | 0.9 /100 | #235 | Tragic 5.1% |
| Central Americans | 0.8 /100 | #236 | Tragic 5.1% |
| Kiowa | 0.8 /100 | #237 | Tragic 5.1% |
| Hondurans | 0.7 /100 | #238 | Tragic 5.1% |
| Nigerians | 0.7 /100 | #239 | Tragic 5.1% |
| Somalis | 0.7 /100 | #240 | Tragic 5.1% |
| Immigrants | Honduras | 0.6 /100 | #241 | Tragic 5.1% |
| Delaware | 0.5 /100 | #242 | Tragic 5.1% |
| Salvadorans | 0.4 /100 | #243 | Tragic 5.1% |
| Guatemalans | 0.4 /100 | #244 | Tragic 5.1% |
| Bahamians | 0.4 /100 | #245 | Tragic 5.2% |
| Immigrants | Guatemala | 0.4 /100 | #246 | Tragic 5.2% |
| Immigrants | Somalia | 0.3 /100 | #247 | Tragic 5.2% |
| Alsatians | 0.2 /100 | #248 | Tragic 5.2% |
Demographics Similar to Cape Verdeans by Unemployment Among Ages 35 to 44 years
In terms of unemployment among ages 35 to 44 years, the demographic groups most similar to Cape Verdeans are Alaska Native (6.6%, a difference of 0.050%), Immigrants from Yemen (6.6%, a difference of 0.12%), Menominee (6.5%, a difference of 0.47%), Shoshone (6.6%, a difference of 0.69%), and Dominican (6.4%, a difference of 2.1%).
| Demographics | Rating | Rank | Unemployment Among Ages 35 to 44 years |
| Immigrants | Armenia | 0.0 /100 | #320 | Tragic 6.2% |
| Chippewa | 0.0 /100 | #321 | Tragic 6.2% |
| Immigrants | Dominican Republic | 0.0 /100 | #322 | Tragic 6.4% |
| Dominicans | 0.0 /100 | #323 | Tragic 6.4% |
| Menominee | 0.0 /100 | #324 | Tragic 6.5% |
| Immigrants | Yemen | 0.0 /100 | #325 | Tragic 6.6% |
| Alaska Natives | 0.0 /100 | #326 | Tragic 6.6% |
| Cape Verdeans | 0.0 /100 | #327 | Tragic 6.6% |
| Shoshone | 0.0 /100 | #328 | Tragic 6.6% |
| Paiute | 0.0 /100 | #329 | Tragic 6.9% |
| Immigrants | Cabo Verde | 0.0 /100 | #330 | Tragic 6.9% |
| Pueblo | 0.0 /100 | #331 | Tragic 7.1% |
| Natives/Alaskans | 0.0 /100 | #332 | Tragic 7.3% |
| Puerto Ricans | 0.0 /100 | #333 | Tragic 7.6% |
| Houma | 0.0 /100 | #334 | Tragic 7.8% |