Latvian vs Cape Verdean Male Poverty
COMPARE
Latvian
Cape Verdean
Male Poverty
Male Poverty Comparison
Latvians
Cape Verdeans
9.6%
MALE POVERTY
99.7/ 100
METRIC RATING
20th/ 347
METRIC RANK
13.1%
MALE POVERTY
0.1/ 100
METRIC RATING
258th/ 347
METRIC RANK
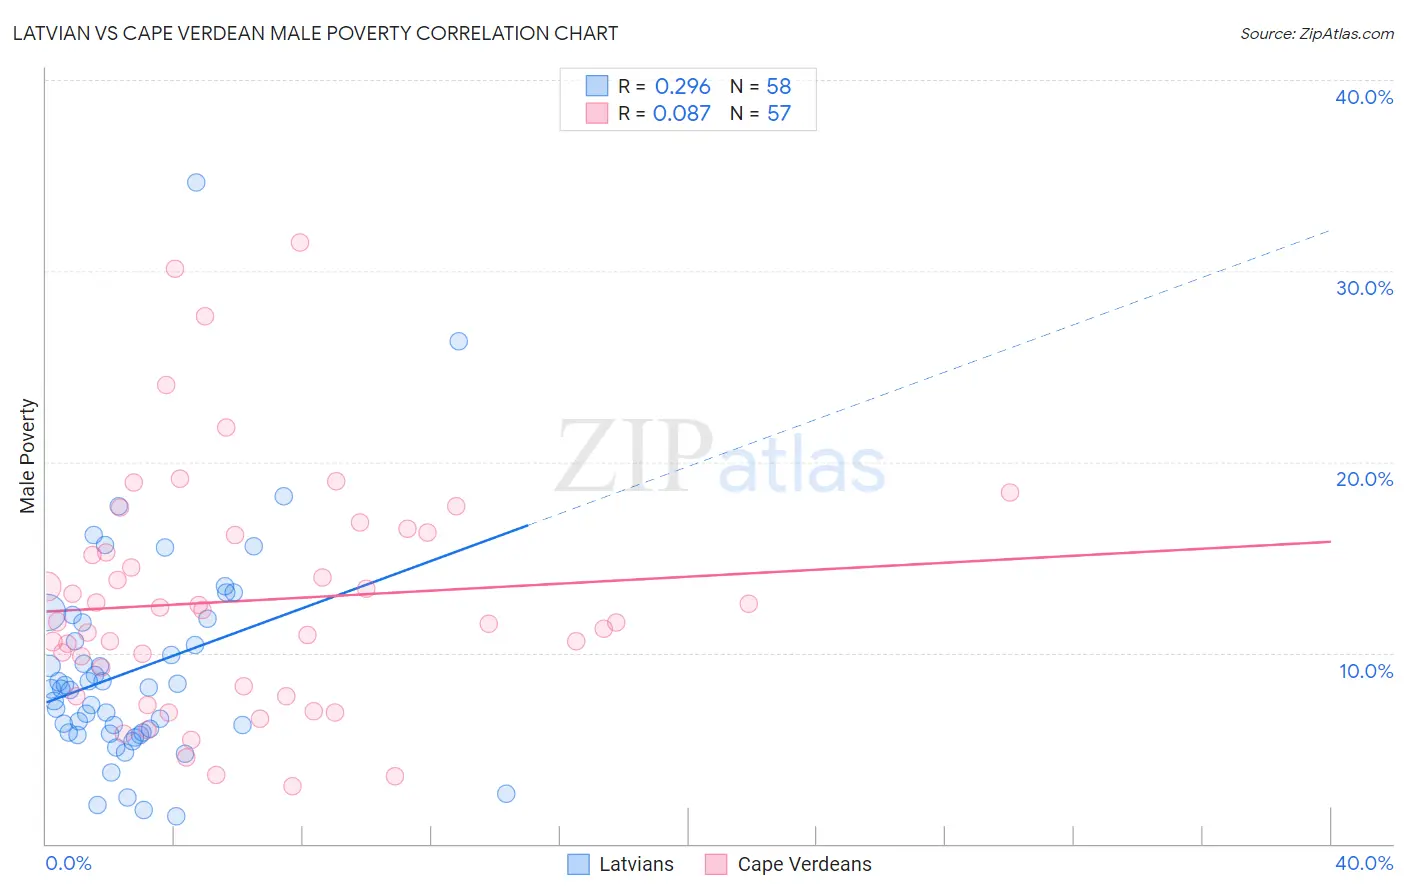
Latvian vs Cape Verdean Male Poverty Correlation Chart
The statistical analysis conducted on geographies consisting of 220,591,162 people shows a weak positive correlation between the proportion of Latvians and poverty level among males in the United States with a correlation coefficient (R) of 0.296 and weighted average of 9.6%. Similarly, the statistical analysis conducted on geographies consisting of 107,527,352 people shows a slight positive correlation between the proportion of Cape Verdeans and poverty level among males in the United States with a correlation coefficient (R) of 0.087 and weighted average of 13.1%, a difference of 36.6%.
Male Poverty Correlation Summary
| Measurement | Latvian | Cape Verdean |
| Minimum | 1.5% | 3.0% |
| Maximum | 34.6% | 31.5% |
| Range | 33.2% | 28.5% |
| Mean | 9.2% | 12.7% |
| Median | 8.1% | 11.6% |
| Interquartile 25% (IQ1) | 5.8% | 8.0% |
| Interquartile 75% (IQ3) | 11.6% | 16.2% |
| Interquartile Range (IQR) | 5.8% | 8.3% |
| Standard Deviation (Sample) | 5.7% | 6.2% |
| Standard Deviation (Population) | 5.7% | 6.1% |
Similar Demographics by Male Poverty
Demographics Similar to Latvians by Male Poverty
In terms of male poverty, the demographic groups most similar to Latvians are Immigrants from Hong Kong (9.6%, a difference of 0.10%), Immigrants from Scotland (9.6%, a difference of 0.26%), Lithuanian (9.5%, a difference of 0.28%), Norwegian (9.5%, a difference of 0.45%), and Croatian (9.6%, a difference of 0.51%).
| Demographics | Rating | Rank | Male Poverty |
| Immigrants | Lithuania | 99.9 /100 | #13 | Exceptional 9.4% |
| Immigrants | North Macedonia | 99.8 /100 | #14 | Exceptional 9.4% |
| Bhutanese | 99.8 /100 | #15 | Exceptional 9.5% |
| Luxembourgers | 99.8 /100 | #16 | Exceptional 9.5% |
| Norwegians | 99.8 /100 | #17 | Exceptional 9.5% |
| Lithuanians | 99.8 /100 | #18 | Exceptional 9.5% |
| Immigrants | Hong Kong | 99.7 /100 | #19 | Exceptional 9.6% |
| Latvians | 99.7 /100 | #20 | Exceptional 9.6% |
| Immigrants | Scotland | 99.7 /100 | #21 | Exceptional 9.6% |
| Croatians | 99.7 /100 | #22 | Exceptional 9.6% |
| Italians | 99.7 /100 | #23 | Exceptional 9.6% |
| Swedes | 99.7 /100 | #24 | Exceptional 9.6% |
| Eastern Europeans | 99.6 /100 | #25 | Exceptional 9.6% |
| Burmese | 99.6 /100 | #26 | Exceptional 9.7% |
| Danes | 99.6 /100 | #27 | Exceptional 9.7% |
Demographics Similar to Cape Verdeans by Male Poverty
In terms of male poverty, the demographic groups most similar to Cape Verdeans are Immigrants from Trinidad and Tobago (13.1%, a difference of 0.13%), Cherokee (13.1%, a difference of 0.16%), Ottawa (13.1%, a difference of 0.28%), Trinidadian and Tobagonian (13.1%, a difference of 0.30%), and Spanish American Indian (13.1%, a difference of 0.35%).
| Demographics | Rating | Rank | Male Poverty |
| Immigrants | Cuba | 0.2 /100 | #251 | Tragic 12.9% |
| Immigrants | Ecuador | 0.2 /100 | #252 | Tragic 12.9% |
| Immigrants | Ghana | 0.2 /100 | #253 | Tragic 12.9% |
| Mexican American Indians | 0.1 /100 | #254 | Tragic 13.0% |
| Immigrants | Liberia | 0.1 /100 | #255 | Tragic 13.0% |
| Immigrants | Burma/Myanmar | 0.1 /100 | #256 | Tragic 13.0% |
| Immigrants | Trinidad and Tobago | 0.1 /100 | #257 | Tragic 13.1% |
| Cape Verdeans | 0.1 /100 | #258 | Tragic 13.1% |
| Cherokee | 0.1 /100 | #259 | Tragic 13.1% |
| Ottawa | 0.1 /100 | #260 | Tragic 13.1% |
| Trinidadians and Tobagonians | 0.1 /100 | #261 | Tragic 13.1% |
| Spanish American Indians | 0.1 /100 | #262 | Tragic 13.1% |
| Central Americans | 0.1 /100 | #263 | Tragic 13.2% |
| Iroquois | 0.1 /100 | #264 | Tragic 13.2% |
| Jamaicans | 0.1 /100 | #265 | Tragic 13.2% |