Kiowa vs Cherokee Unemployment
COMPARE
Kiowa
Cherokee
Unemployment
Unemployment Comparison
Kiowa
Cherokee
5.7%
UNEMPLOYMENT
0.6/ 100
METRIC RATING
251st/ 347
METRIC RANK
5.3%
UNEMPLOYMENT
25.5/ 100
METRIC RATING
202nd/ 347
METRIC RANK
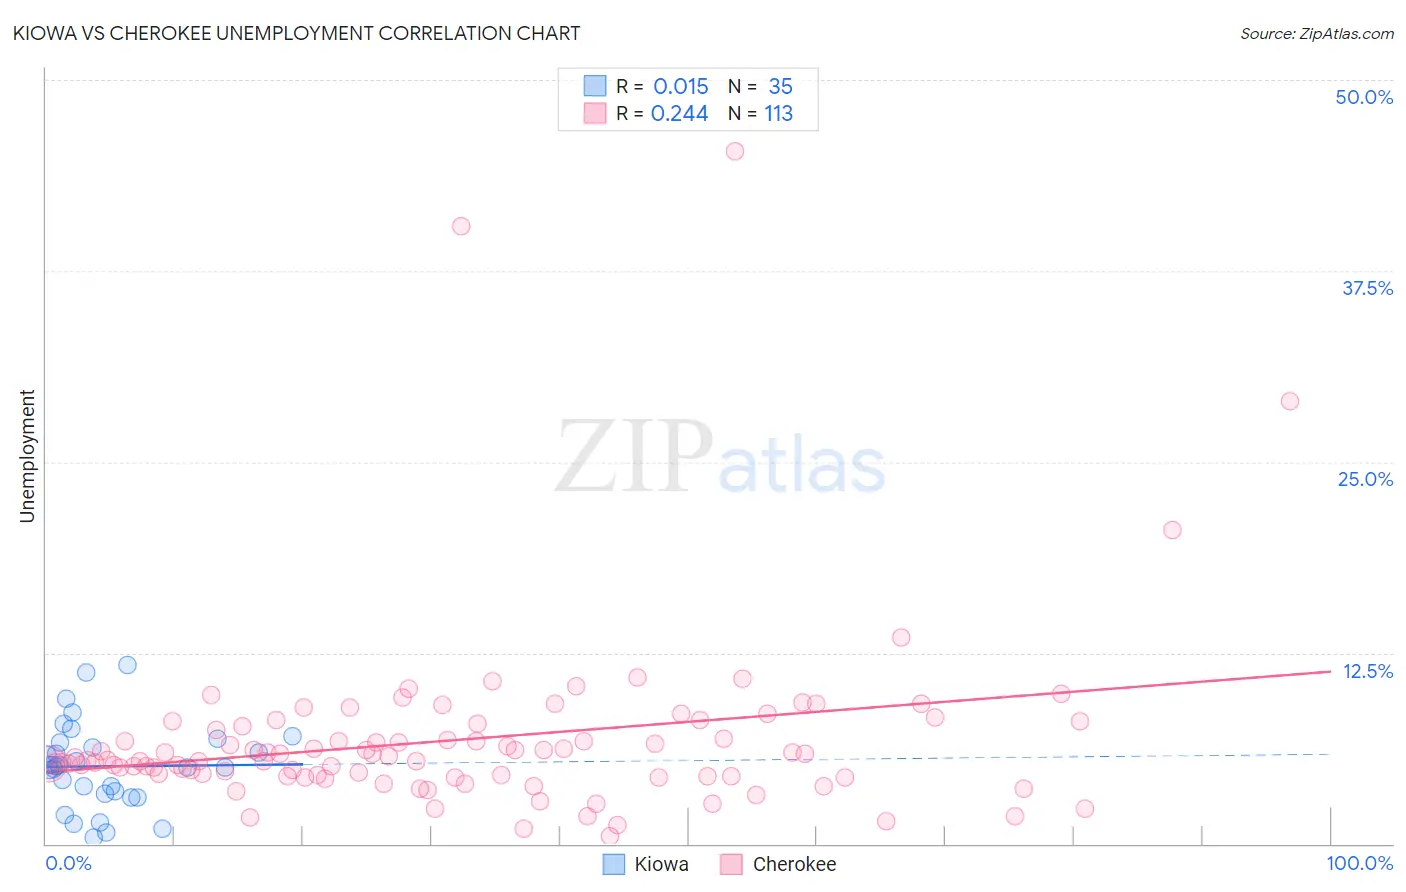
Kiowa vs Cherokee Unemployment Correlation Chart
The statistical analysis conducted on geographies consisting of 56,085,771 people shows no correlation between the proportion of Kiowa and unemployment in the United States with a correlation coefficient (R) of 0.015 and weighted average of 5.7%. Similarly, the statistical analysis conducted on geographies consisting of 492,075,585 people shows a weak positive correlation between the proportion of Cherokee and unemployment in the United States with a correlation coefficient (R) of 0.244 and weighted average of 5.3%, a difference of 6.2%.
Unemployment Correlation Summary
| Measurement | Kiowa | Cherokee |
| Minimum | 0.44% | 0.50% |
| Maximum | 11.7% | 45.3% |
| Range | 11.3% | 44.8% |
| Mean | 5.1% | 6.8% |
| Median | 5.1% | 5.5% |
| Interquartile 25% (IQ1) | 3.3% | 4.4% |
| Interquartile 75% (IQ3) | 6.6% | 7.8% |
| Interquartile Range (IQR) | 3.3% | 3.3% |
| Standard Deviation (Sample) | 2.7% | 6.0% |
| Standard Deviation (Population) | 2.7% | 6.0% |
Similar Demographics by Unemployment
Demographics Similar to Kiowa by Unemployment
In terms of unemployment, the demographic groups most similar to Kiowa are Japanese (5.6%, a difference of 0.47%), Cajun (5.6%, a difference of 0.48%), Liberian (5.6%, a difference of 0.74%), Honduran (5.7%, a difference of 0.74%), and Central American (5.7%, a difference of 0.75%).
| Demographics | Rating | Rank | Unemployment |
| Dutch West Indians | 1.2 /100 | #244 | Tragic 5.6% |
| French American Indians | 1.2 /100 | #245 | Tragic 5.6% |
| Bermudans | 1.1 /100 | #246 | Tragic 5.6% |
| Immigrants | Cameroon | 1.0 /100 | #247 | Tragic 5.6% |
| Liberians | 0.9 /100 | #248 | Tragic 5.6% |
| Cajuns | 0.8 /100 | #249 | Tragic 5.6% |
| Japanese | 0.8 /100 | #250 | Tragic 5.6% |
| Kiowa | 0.6 /100 | #251 | Tragic 5.7% |
| Hondurans | 0.3 /100 | #252 | Tragic 5.7% |
| Central Americans | 0.3 /100 | #253 | Tragic 5.7% |
| Immigrants | Honduras | 0.3 /100 | #254 | Tragic 5.7% |
| Immigrants | Portugal | 0.2 /100 | #255 | Tragic 5.7% |
| Guatemalans | 0.2 /100 | #256 | Tragic 5.8% |
| Yaqui | 0.2 /100 | #257 | Tragic 5.8% |
| Immigrants | Bahamas | 0.1 /100 | #258 | Tragic 5.8% |
Demographics Similar to Cherokee by Unemployment
In terms of unemployment, the demographic groups most similar to Cherokee are Immigrants from Micronesia (5.3%, a difference of 0.030%), Immigrants from Ukraine (5.3%, a difference of 0.050%), Native Hawaiian (5.3%, a difference of 0.11%), Immigrants from South Eastern Asia (5.3%, a difference of 0.12%), and Korean (5.3%, a difference of 0.14%).
| Demographics | Rating | Rank | Unemployment |
| Immigrants | Southern Europe | 30.9 /100 | #195 | Fair 5.3% |
| Peruvians | 29.9 /100 | #196 | Fair 5.3% |
| Immigrants | Uruguay | 29.8 /100 | #197 | Fair 5.3% |
| Immigrants | Israel | 28.6 /100 | #198 | Fair 5.3% |
| Immigrants | Afghanistan | 28.6 /100 | #199 | Fair 5.3% |
| Koreans | 27.4 /100 | #200 | Fair 5.3% |
| Immigrants | South Eastern Asia | 27.0 /100 | #201 | Fair 5.3% |
| Cherokee | 25.5 /100 | #202 | Fair 5.3% |
| Immigrants | Micronesia | 25.2 /100 | #203 | Fair 5.3% |
| Immigrants | Ukraine | 24.9 /100 | #204 | Fair 5.3% |
| Native Hawaiians | 24.1 /100 | #205 | Fair 5.3% |
| Immigrants | Peru | 22.7 /100 | #206 | Fair 5.4% |
| Creek | 19.4 /100 | #207 | Poor 5.4% |
| Portuguese | 19.0 /100 | #208 | Poor 5.4% |
| Immigrants | Iran | 18.8 /100 | #209 | Poor 5.4% |