Kiowa vs Nicaraguan Male Unemployment
COMPARE
Kiowa
Nicaraguan
Male Unemployment
Male Unemployment Comparison
Kiowa
Nicaraguans
5.8%
MALE UNEMPLOYMENT
0.2/ 100
METRIC RATING
255th/ 347
METRIC RANK
5.1%
MALE UNEMPLOYMENT
88.2/ 100
METRIC RATING
122nd/ 347
METRIC RANK
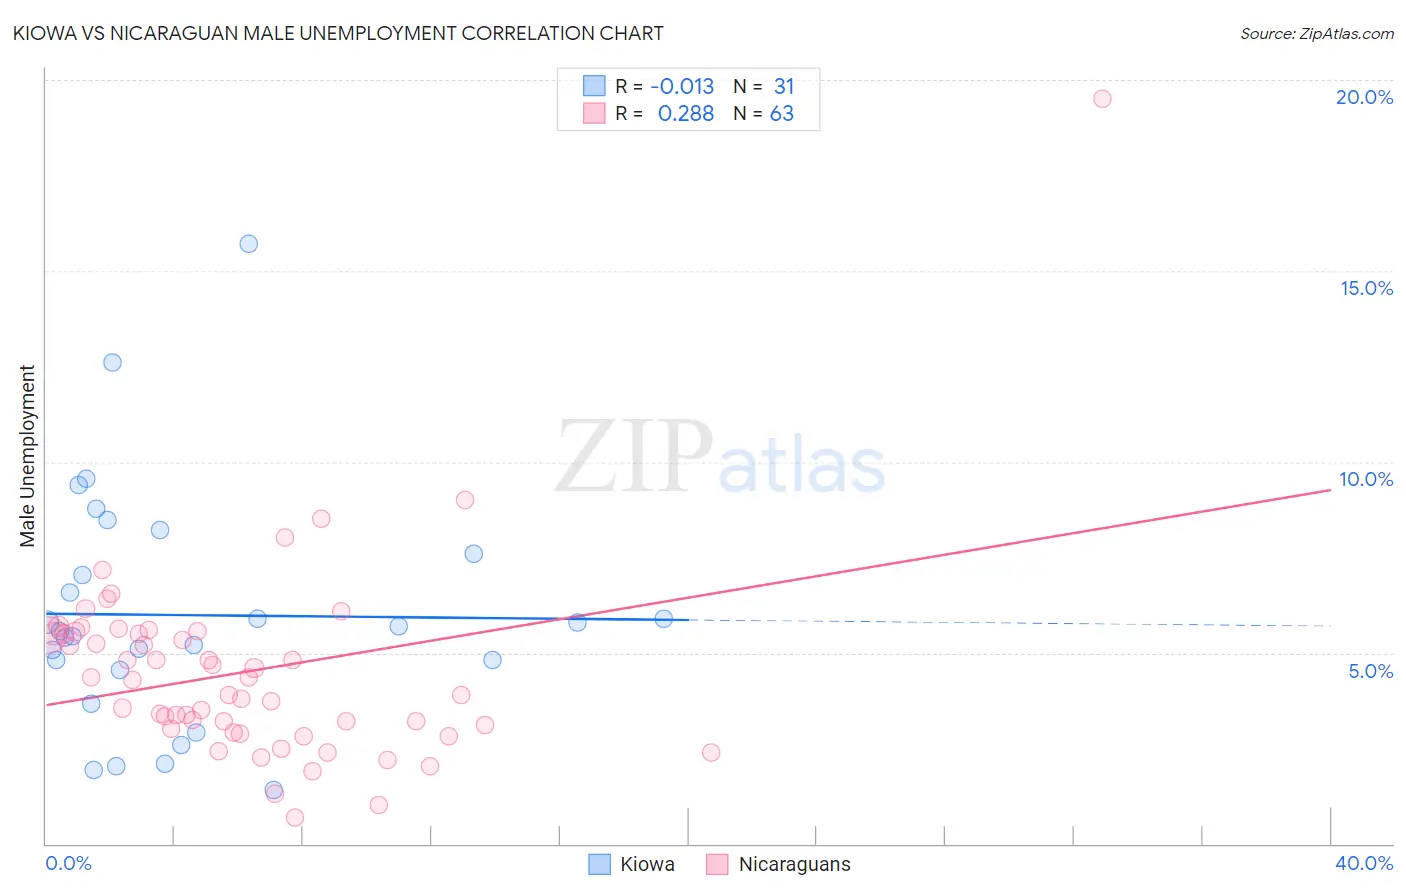
Kiowa vs Nicaraguan Male Unemployment Correlation Chart
The statistical analysis conducted on geographies consisting of 56,015,604 people shows no correlation between the proportion of Kiowa and unemployment rate among males in the United States with a correlation coefficient (R) of -0.013 and weighted average of 5.8%. Similarly, the statistical analysis conducted on geographies consisting of 285,177,185 people shows a weak positive correlation between the proportion of Nicaraguans and unemployment rate among males in the United States with a correlation coefficient (R) of 0.288 and weighted average of 5.1%, a difference of 12.6%.
Male Unemployment Correlation Summary
| Measurement | Kiowa | Nicaraguan |
| Minimum | 1.4% | 0.70% |
| Maximum | 15.7% | 19.5% |
| Range | 14.3% | 18.8% |
| Mean | 6.0% | 4.5% |
| Median | 5.6% | 4.3% |
| Interquartile 25% (IQ1) | 4.5% | 3.0% |
| Interquartile 75% (IQ3) | 7.6% | 5.5% |
| Interquartile Range (IQR) | 3.1% | 2.5% |
| Standard Deviation (Sample) | 3.1% | 2.6% |
| Standard Deviation (Population) | 3.0% | 2.6% |
Similar Demographics by Male Unemployment
Demographics Similar to Kiowa by Male Unemployment
In terms of male unemployment, the demographic groups most similar to Kiowa are Comanche (5.8%, a difference of 0.080%), Japanese (5.8%, a difference of 0.10%), Hispanic or Latino (5.8%, a difference of 0.25%), Mexican American Indian (5.8%, a difference of 0.28%), and Dutch West Indian (5.8%, a difference of 0.38%).
| Demographics | Rating | Rank | Male Unemployment |
| Marshallese | 0.5 /100 | #248 | Tragic 5.7% |
| Cree | 0.4 /100 | #249 | Tragic 5.7% |
| Immigrants | Bahamas | 0.4 /100 | #250 | Tragic 5.7% |
| Spanish Americans | 0.3 /100 | #251 | Tragic 5.7% |
| Mexicans | 0.2 /100 | #252 | Tragic 5.8% |
| Mexican American Indians | 0.2 /100 | #253 | Tragic 5.8% |
| Japanese | 0.2 /100 | #254 | Tragic 5.8% |
| Kiowa | 0.2 /100 | #255 | Tragic 5.8% |
| Comanche | 0.2 /100 | #256 | Tragic 5.8% |
| Hispanics or Latinos | 0.1 /100 | #257 | Tragic 5.8% |
| Dutch West Indians | 0.1 /100 | #258 | Tragic 5.8% |
| Cajuns | 0.1 /100 | #259 | Tragic 5.8% |
| Immigrants | Central America | 0.1 /100 | #260 | Tragic 5.8% |
| Liberians | 0.1 /100 | #261 | Tragic 5.8% |
| Immigrants | Portugal | 0.1 /100 | #262 | Tragic 5.9% |
Demographics Similar to Nicaraguans by Male Unemployment
In terms of male unemployment, the demographic groups most similar to Nicaraguans are Mongolian (5.1%, a difference of 0.030%), Ukrainian (5.1%, a difference of 0.040%), French Canadian (5.1%, a difference of 0.060%), Palestinian (5.1%, a difference of 0.070%), and Cypriot (5.1%, a difference of 0.10%).
| Demographics | Rating | Rank | Male Unemployment |
| Immigrants | Asia | 89.6 /100 | #115 | Excellent 5.1% |
| Immigrants | Denmark | 89.4 /100 | #116 | Excellent 5.1% |
| Estonians | 89.0 /100 | #117 | Excellent 5.1% |
| Cypriots | 88.8 /100 | #118 | Excellent 5.1% |
| French Canadians | 88.6 /100 | #119 | Excellent 5.1% |
| Ukrainians | 88.4 /100 | #120 | Excellent 5.1% |
| Mongolians | 88.4 /100 | #121 | Excellent 5.1% |
| Nicaraguans | 88.2 /100 | #122 | Excellent 5.1% |
| Palestinians | 87.7 /100 | #123 | Excellent 5.1% |
| Immigrants | Latvia | 87.5 /100 | #124 | Excellent 5.1% |
| Immigrants | Lithuania | 87.2 /100 | #125 | Excellent 5.1% |
| Immigrants | Colombia | 86.8 /100 | #126 | Excellent 5.1% |
| Immigrants | Brazil | 86.3 /100 | #127 | Excellent 5.2% |
| Hungarians | 85.1 /100 | #128 | Excellent 5.2% |
| Immigrants | Western Europe | 84.8 /100 | #129 | Excellent 5.2% |