Jordanian vs Somali Unemployment
COMPARE
Jordanian
Somali
Unemployment
Unemployment Comparison
Jordanians
Somalis
5.0%
UNEMPLOYMENT
96.4/ 100
METRIC RATING
89th/ 347
METRIC RANK
5.3%
UNEMPLOYMENT
34.0/ 100
METRIC RATING
191st/ 347
METRIC RANK
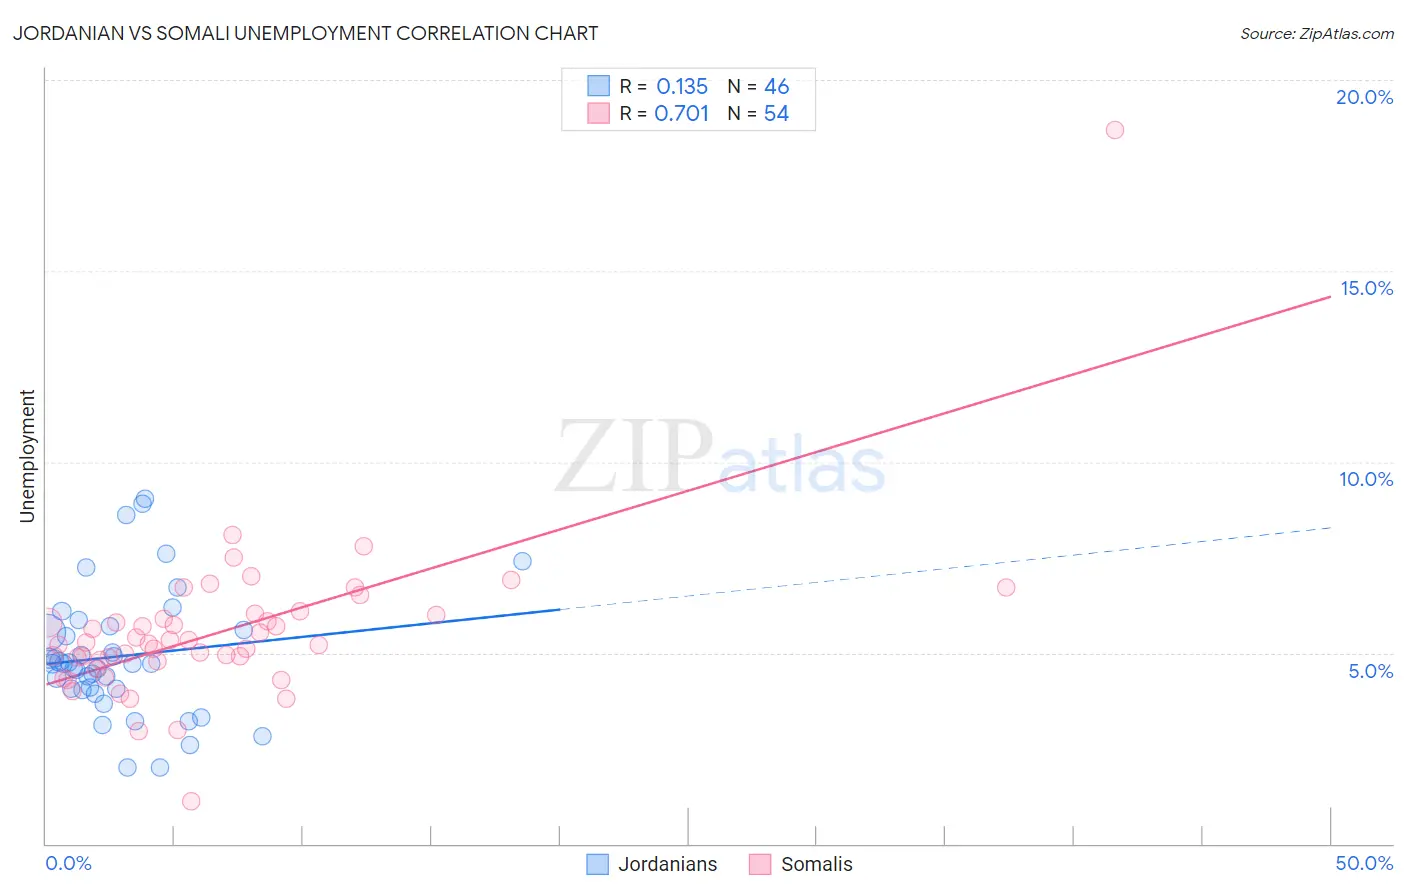
Jordanian vs Somali Unemployment Correlation Chart
The statistical analysis conducted on geographies consisting of 166,387,098 people shows a poor positive correlation between the proportion of Jordanians and unemployment in the United States with a correlation coefficient (R) of 0.135 and weighted average of 5.0%. Similarly, the statistical analysis conducted on geographies consisting of 99,308,248 people shows a strong positive correlation between the proportion of Somalis and unemployment in the United States with a correlation coefficient (R) of 0.701 and weighted average of 5.3%, a difference of 6.4%.
Unemployment Correlation Summary
| Measurement | Jordanian | Somali |
| Minimum | 2.0% | 1.1% |
| Maximum | 9.0% | 18.7% |
| Range | 7.0% | 17.6% |
| Mean | 4.9% | 5.6% |
| Median | 4.7% | 5.3% |
| Interquartile 25% (IQ1) | 4.1% | 4.8% |
| Interquartile 75% (IQ3) | 5.6% | 6.0% |
| Interquartile Range (IQR) | 1.5% | 1.2% |
| Standard Deviation (Sample) | 1.6% | 2.2% |
| Standard Deviation (Population) | 1.6% | 2.2% |
Similar Demographics by Unemployment
Demographics Similar to Jordanians by Unemployment
In terms of unemployment, the demographic groups most similar to Jordanians are Immigrants from North Macedonia (5.0%, a difference of 0.040%), Immigrants from Sudan (5.0%, a difference of 0.050%), Immigrants from South Africa (5.0%, a difference of 0.070%), Immigrants from Korea (5.0%, a difference of 0.090%), and Immigrants from Moldova (5.0%, a difference of 0.12%).
| Demographics | Rating | Rank | Unemployment |
| Fijians | 97.6 /100 | #82 | Exceptional 5.0% |
| Hmong | 97.6 /100 | #83 | Exceptional 5.0% |
| Russians | 97.4 /100 | #84 | Exceptional 5.0% |
| Immigrants | Australia | 97.0 /100 | #85 | Exceptional 5.0% |
| Hungarians | 96.9 /100 | #86 | Exceptional 5.0% |
| Immigrants | Moldova | 96.6 /100 | #87 | Exceptional 5.0% |
| Immigrants | Korea | 96.6 /100 | #88 | Exceptional 5.0% |
| Jordanians | 96.4 /100 | #89 | Exceptional 5.0% |
| Immigrants | North Macedonia | 96.3 /100 | #90 | Exceptional 5.0% |
| Immigrants | Sudan | 96.3 /100 | #91 | Exceptional 5.0% |
| Immigrants | South Africa | 96.2 /100 | #92 | Exceptional 5.0% |
| Ukrainians | 96.0 /100 | #93 | Exceptional 5.0% |
| Immigrants | Austria | 95.9 /100 | #94 | Exceptional 5.0% |
| Immigrants | Serbia | 95.6 /100 | #95 | Exceptional 5.0% |
| Immigrants | England | 95.2 /100 | #96 | Exceptional 5.0% |
Demographics Similar to Somalis by Unemployment
In terms of unemployment, the demographic groups most similar to Somalis are South American (5.3%, a difference of 0.0%), Immigrants from Somalia (5.3%, a difference of 0.010%), Arab (5.3%, a difference of 0.090%), Immigrants from Belarus (5.3%, a difference of 0.11%), and Alsatian (5.3%, a difference of 0.20%).
| Demographics | Rating | Rank | Unemployment |
| Assyrians/Chaldeans/Syriacs | 39.2 /100 | #184 | Fair 5.3% |
| Immigrants | Thailand | 38.9 /100 | #185 | Fair 5.3% |
| Immigrants | Uganda | 37.8 /100 | #186 | Fair 5.3% |
| Costa Ricans | 37.4 /100 | #187 | Fair 5.3% |
| Alsatians | 37.0 /100 | #188 | Fair 5.3% |
| Immigrants | Belarus | 35.6 /100 | #189 | Fair 5.3% |
| Arabs | 35.3 /100 | #190 | Fair 5.3% |
| Somalis | 34.0 /100 | #191 | Fair 5.3% |
| South Americans | 33.9 /100 | #192 | Fair 5.3% |
| Immigrants | Somalia | 33.8 /100 | #193 | Fair 5.3% |
| Immigrants | Laos | 30.9 /100 | #194 | Fair 5.3% |
| Immigrants | Southern Europe | 30.9 /100 | #195 | Fair 5.3% |
| Peruvians | 29.9 /100 | #196 | Fair 5.3% |
| Immigrants | Uruguay | 29.8 /100 | #197 | Fair 5.3% |
| Immigrants | Israel | 28.6 /100 | #198 | Fair 5.3% |