Jordanian vs New Zealander 11th Grade
COMPARE
Jordanian
New Zealander
11th Grade
11th Grade Comparison
Jordanians
New Zealanders
93.4%
11TH GRADE
97.8/ 100
METRIC RATING
114th/ 347
METRIC RANK
94.0%
11TH GRADE
99.9/ 100
METRIC RATING
57th/ 347
METRIC RANK
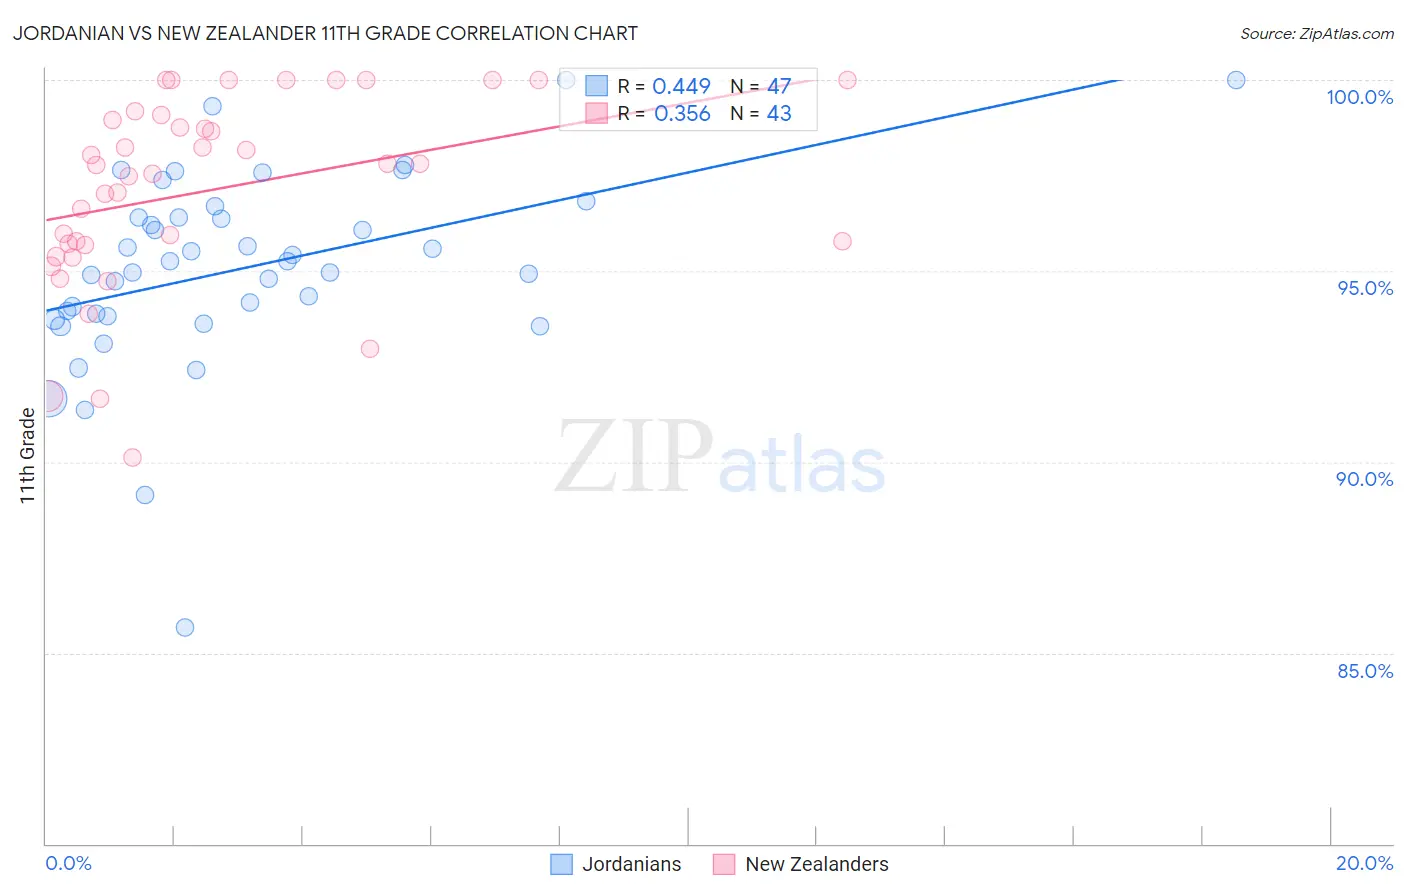
Jordanian vs New Zealander 11th Grade Correlation Chart
The statistical analysis conducted on geographies consisting of 166,402,085 people shows a moderate positive correlation between the proportion of Jordanians and percentage of population with at least 11th grade education in the United States with a correlation coefficient (R) of 0.449 and weighted average of 93.4%. Similarly, the statistical analysis conducted on geographies consisting of 106,912,053 people shows a mild positive correlation between the proportion of New Zealanders and percentage of population with at least 11th grade education in the United States with a correlation coefficient (R) of 0.356 and weighted average of 94.0%, a difference of 0.66%.
11th Grade Correlation Summary
| Measurement | Jordanian | New Zealander |
| Minimum | 85.7% | 90.1% |
| Maximum | 100.0% | 100.0% |
| Range | 14.3% | 9.9% |
| Mean | 95.1% | 97.1% |
| Median | 95.2% | 97.8% |
| Interquartile 25% (IQ1) | 93.8% | 95.7% |
| Interquartile 75% (IQ3) | 96.4% | 99.1% |
| Interquartile Range (IQR) | 2.6% | 3.4% |
| Standard Deviation (Sample) | 2.6% | 2.5% |
| Standard Deviation (Population) | 2.5% | 2.5% |
Similar Demographics by 11th Grade
Demographics Similar to Jordanians by 11th Grade
In terms of 11th grade, the demographic groups most similar to Jordanians are Immigrants from Zimbabwe (93.4%, a difference of 0.0%), Palestinian (93.4%, a difference of 0.010%), Immigrants from Germany (93.4%, a difference of 0.030%), Immigrants from Hungary (93.4%, a difference of 0.030%), and Yugoslavian (93.4%, a difference of 0.040%).
| Demographics | Rating | Rank | 11th Grade |
| Immigrants | Norway | 98.4 /100 | #107 | Exceptional 93.5% |
| Alaska Natives | 98.4 /100 | #108 | Exceptional 93.5% |
| Immigrants | Kuwait | 98.4 /100 | #109 | Exceptional 93.5% |
| Syrians | 98.4 /100 | #110 | Exceptional 93.4% |
| Yugoslavians | 98.1 /100 | #111 | Exceptional 93.4% |
| Immigrants | Germany | 98.0 /100 | #112 | Exceptional 93.4% |
| Immigrants | Zimbabwe | 97.8 /100 | #113 | Exceptional 93.4% |
| Jordanians | 97.8 /100 | #114 | Exceptional 93.4% |
| Palestinians | 97.7 /100 | #115 | Exceptional 93.4% |
| Immigrants | Hungary | 97.5 /100 | #116 | Exceptional 93.4% |
| Whites/Caucasians | 97.4 /100 | #117 | Exceptional 93.3% |
| Immigrants | Korea | 97.0 /100 | #118 | Exceptional 93.3% |
| Israelis | 97.0 /100 | #119 | Exceptional 93.3% |
| Immigrants | Russia | 96.6 /100 | #120 | Exceptional 93.3% |
| German Russians | 96.4 /100 | #121 | Exceptional 93.3% |
Demographics Similar to New Zealanders by 11th Grade
In terms of 11th grade, the demographic groups most similar to New Zealanders are French Canadian (94.0%, a difference of 0.0%), Iranian (94.0%, a difference of 0.0%), Bhutanese (94.0%, a difference of 0.0%), Okinawan (94.0%, a difference of 0.0%), and Immigrants from North America (94.0%, a difference of 0.010%).
| Demographics | Rating | Rank | 11th Grade |
| French | 99.9 /100 | #50 | Exceptional 94.1% |
| Turks | 99.9 /100 | #51 | Exceptional 94.0% |
| Immigrants | Canada | 99.9 /100 | #52 | Exceptional 94.0% |
| Immigrants | Australia | 99.9 /100 | #53 | Exceptional 94.0% |
| Immigrants | North America | 99.9 /100 | #54 | Exceptional 94.0% |
| Czechoslovakians | 99.9 /100 | #55 | Exceptional 94.0% |
| French Canadians | 99.9 /100 | #56 | Exceptional 94.0% |
| New Zealanders | 99.9 /100 | #57 | Exceptional 94.0% |
| Iranians | 99.9 /100 | #58 | Exceptional 94.0% |
| Bhutanese | 99.8 /100 | #59 | Exceptional 94.0% |
| Okinawans | 99.8 /100 | #60 | Exceptional 94.0% |
| Immigrants | Belgium | 99.8 /100 | #61 | Exceptional 94.0% |
| Austrians | 99.8 /100 | #62 | Exceptional 94.0% |
| Ukrainians | 99.8 /100 | #63 | Exceptional 94.0% |
| Immigrants | Sweden | 99.8 /100 | #64 | Exceptional 93.9% |