Immigrants from Caribbean vs Cuban Unemployment Among Ages 25 to 29 years
COMPARE
Immigrants from Caribbean
Cuban
Unemployment Among Ages 25 to 29 years
Unemployment Among Ages 25 to 29 years Comparison
Immigrants from Caribbean
Cubans
7.5%
UNEMPLOYMENT AMONG AGES 25 TO 29 YEARS
0.0/ 100
METRIC RATING
280th/ 347
METRIC RANK
5.9%
UNEMPLOYMENT AMONG AGES 25 TO 29 YEARS
99.9/ 100
METRIC RATING
15th/ 347
METRIC RANK
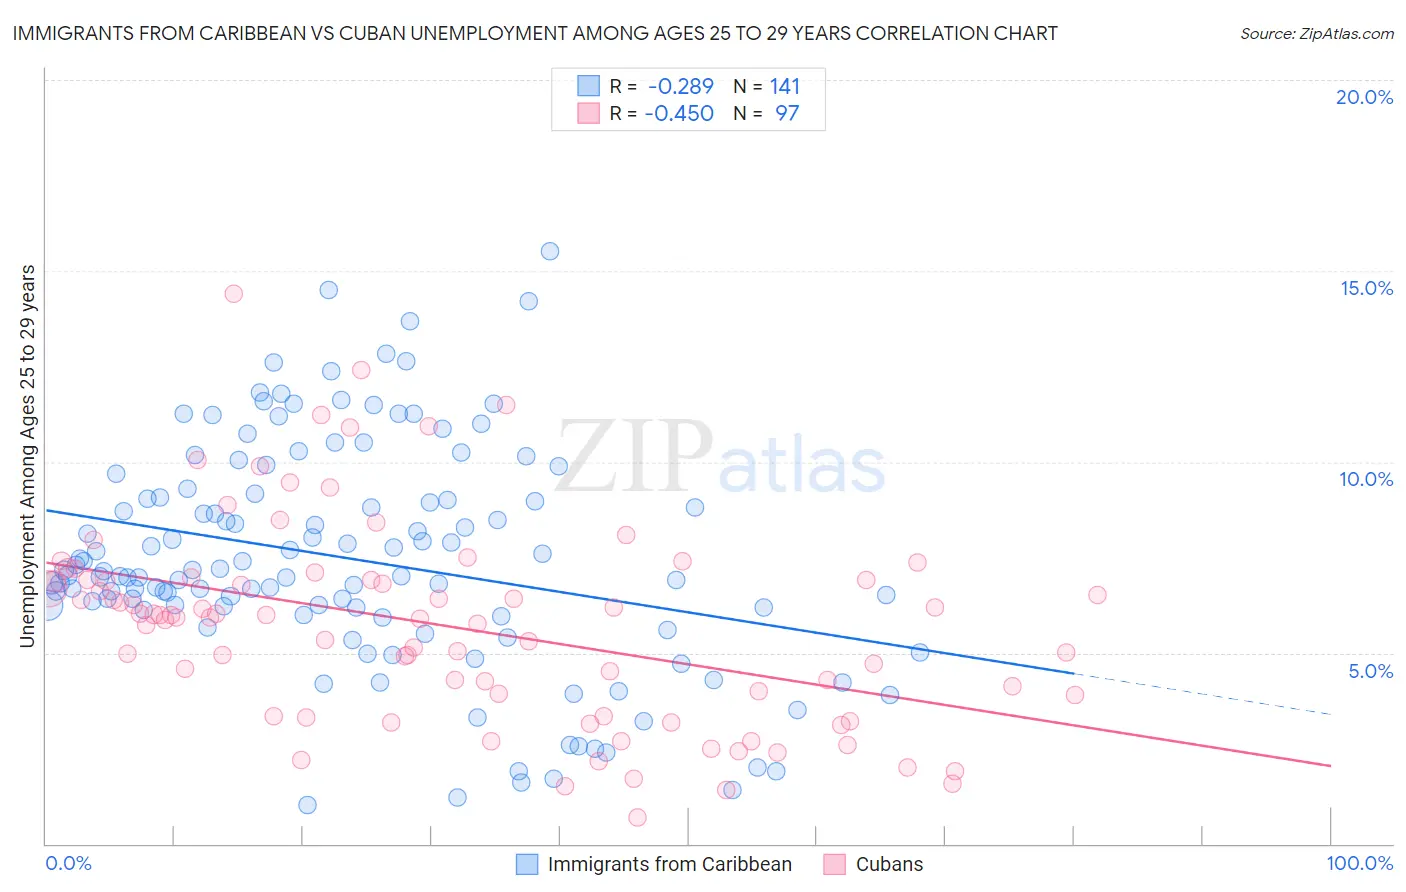
Immigrants from Caribbean vs Cuban Unemployment Among Ages 25 to 29 years Correlation Chart
The statistical analysis conducted on geographies consisting of 424,780,068 people shows a weak negative correlation between the proportion of Immigrants from Caribbean and unemployment rate among population between the ages 25 and 29 in the United States with a correlation coefficient (R) of -0.289 and weighted average of 7.5%. Similarly, the statistical analysis conducted on geographies consisting of 424,519,205 people shows a moderate negative correlation between the proportion of Cubans and unemployment rate among population between the ages 25 and 29 in the United States with a correlation coefficient (R) of -0.450 and weighted average of 5.9%, a difference of 27.6%.
Unemployment Among Ages 25 to 29 years Correlation Summary
| Measurement | Immigrants from Caribbean | Cuban |
| Minimum | 1.0% | 0.70% |
| Maximum | 15.5% | 14.4% |
| Range | 14.5% | 13.7% |
| Mean | 7.5% | 5.7% |
| Median | 7.0% | 5.9% |
| Interquartile 25% (IQ1) | 6.1% | 3.6% |
| Interquartile 75% (IQ3) | 9.1% | 6.9% |
| Interquartile Range (IQR) | 3.0% | 3.3% |
| Standard Deviation (Sample) | 3.0% | 2.6% |
| Standard Deviation (Population) | 3.0% | 2.6% |
Similar Demographics by Unemployment Among Ages 25 to 29 years
Demographics Similar to Immigrants from Caribbean by Unemployment Among Ages 25 to 29 years
In terms of unemployment among ages 25 to 29 years, the demographic groups most similar to Immigrants from Caribbean are Immigrants from Bangladesh (7.5%, a difference of 0.090%), Nepalese (7.5%, a difference of 0.14%), Immigrants from Senegal (7.6%, a difference of 0.26%), Mexican (7.5%, a difference of 0.27%), and Iroquois (7.5%, a difference of 0.31%).
| Demographics | Rating | Rank | Unemployment Among Ages 25 to 29 years |
| Immigrants | Nigeria | 0.0 /100 | #273 | Tragic 7.5% |
| Immigrants | Central America | 0.0 /100 | #274 | Tragic 7.5% |
| Immigrants | Ghana | 0.0 /100 | #275 | Tragic 7.5% |
| French American Indians | 0.0 /100 | #276 | Tragic 7.5% |
| Iroquois | 0.0 /100 | #277 | Tragic 7.5% |
| Mexicans | 0.0 /100 | #278 | Tragic 7.5% |
| Nepalese | 0.0 /100 | #279 | Tragic 7.5% |
| Immigrants | Caribbean | 0.0 /100 | #280 | Tragic 7.5% |
| Immigrants | Bangladesh | 0.0 /100 | #281 | Tragic 7.5% |
| Immigrants | Senegal | 0.0 /100 | #282 | Tragic 7.6% |
| Creek | 0.0 /100 | #283 | Tragic 7.6% |
| Cherokee | 0.0 /100 | #284 | Tragic 7.6% |
| Senegalese | 0.0 /100 | #285 | Tragic 7.6% |
| Vietnamese | 0.0 /100 | #286 | Tragic 7.6% |
| Immigrants | Mexico | 0.0 /100 | #287 | Tragic 7.6% |
Demographics Similar to Cubans by Unemployment Among Ages 25 to 29 years
In terms of unemployment among ages 25 to 29 years, the demographic groups most similar to Cubans are Immigrants from Bulgaria (5.9%, a difference of 0.010%), Bolivian (5.9%, a difference of 0.15%), Immigrants from Singapore (5.9%, a difference of 0.26%), Immigrants from Kuwait (5.9%, a difference of 0.35%), and Thai (5.9%, a difference of 0.41%).
| Demographics | Rating | Rank | Unemployment Among Ages 25 to 29 years |
| Immigrants | Bosnia and Herzegovina | 100.0 /100 | #8 | Exceptional 5.7% |
| Immigrants | Nepal | 100.0 /100 | #9 | Exceptional 5.7% |
| Immigrants | Sudan | 100.0 /100 | #10 | Exceptional 5.8% |
| Cambodians | 100.0 /100 | #11 | Exceptional 5.8% |
| Okinawans | 100.0 /100 | #12 | Exceptional 5.9% |
| Immigrants | Bolivia | 100.0 /100 | #13 | Exceptional 5.9% |
| Immigrants | Kuwait | 99.9 /100 | #14 | Exceptional 5.9% |
| Cubans | 99.9 /100 | #15 | Exceptional 5.9% |
| Immigrants | Bulgaria | 99.9 /100 | #16 | Exceptional 5.9% |
| Bolivians | 99.9 /100 | #17 | Exceptional 5.9% |
| Immigrants | Singapore | 99.9 /100 | #18 | Exceptional 5.9% |
| Thais | 99.9 /100 | #19 | Exceptional 5.9% |
| Immigrants | Eritrea | 99.9 /100 | #20 | Exceptional 5.9% |
| Immigrants | Ethiopia | 99.9 /100 | #21 | Exceptional 6.0% |
| Immigrants | Japan | 99.9 /100 | #22 | Exceptional 6.0% |