Immigrants from Fiji vs Canadian Unemployment Among Women with Children Ages 6 to 17 years
COMPARE
Immigrants from Fiji
Canadian
Unemployment Among Women with Children Ages 6 to 17 years
Unemployment Among Women with Children Ages 6 to 17 years Comparison
Immigrants from Fiji
Canadians
7.3%
UNEMPLOYMENT AMONG WOMEN WITH CHILDREN AGES 6 TO 17 YEARS
100.0/ 100
METRIC RATING
10th/ 347
METRIC RANK
9.4%
UNEMPLOYMENT AMONG WOMEN WITH CHILDREN AGES 6 TO 17 YEARS
0.8/ 100
METRIC RATING
256th/ 347
METRIC RANK
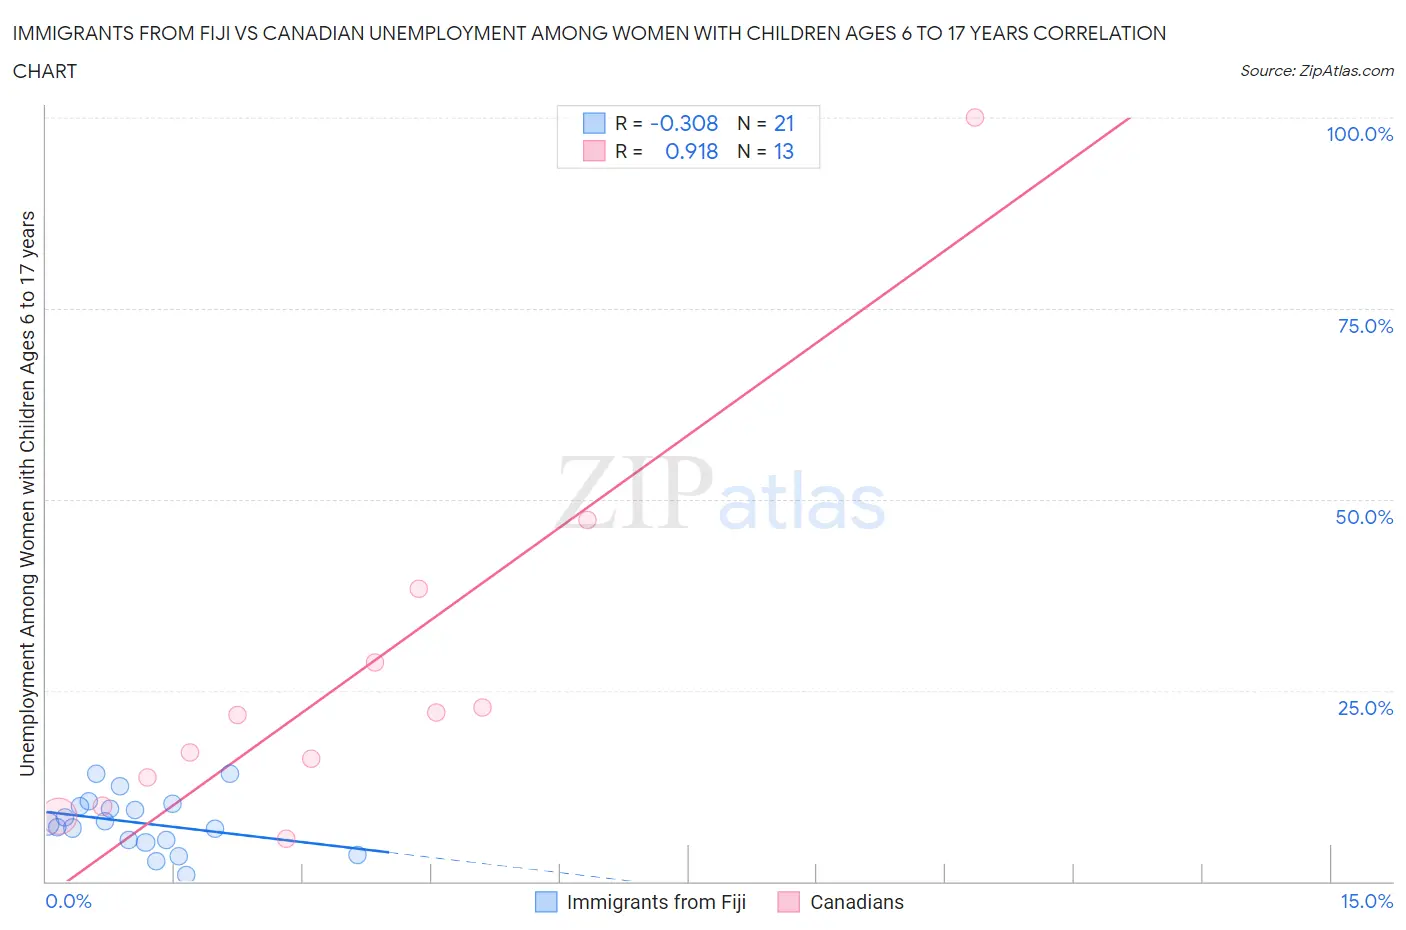
Immigrants from Fiji vs Canadian Unemployment Among Women with Children Ages 6 to 17 years Correlation Chart
The statistical analysis conducted on geographies consisting of 84,843,445 people shows a mild negative correlation between the proportion of Immigrants from Fiji and unemployment rate among women with children between the ages 6 and 17 in the United States with a correlation coefficient (R) of -0.308 and weighted average of 7.3%. Similarly, the statistical analysis conducted on geographies consisting of 299,880,127 people shows a near-perfect positive correlation between the proportion of Canadians and unemployment rate among women with children between the ages 6 and 17 in the United States with a correlation coefficient (R) of 0.918 and weighted average of 9.4%, a difference of 29.8%.
Unemployment Among Women with Children Ages 6 to 17 years Correlation Summary
| Measurement | Immigrants from Fiji | Canadian |
| Minimum | 0.80% | 5.6% |
| Maximum | 14.1% | 100.0% |
| Range | 13.3% | 94.4% |
| Mean | 7.6% | 27.0% |
| Median | 7.5% | 21.8% |
| Interquartile 25% (IQ1) | 5.2% | 11.7% |
| Interquartile 75% (IQ3) | 10.0% | 33.5% |
| Interquartile Range (IQR) | 4.8% | 21.8% |
| Standard Deviation (Sample) | 3.6% | 24.9% |
| Standard Deviation (Population) | 3.5% | 23.9% |
Similar Demographics by Unemployment Among Women with Children Ages 6 to 17 years
Demographics Similar to Immigrants from Fiji by Unemployment Among Women with Children Ages 6 to 17 years
In terms of unemployment among women with children ages 6 to 17 years, the demographic groups most similar to Immigrants from Fiji are Immigrants from Taiwan (7.3%, a difference of 0.70%), Assyrian/Chaldean/Syriac (7.2%, a difference of 0.97%), Bangladeshi (7.4%, a difference of 1.0%), Immigrants from Hong Kong (7.2%, a difference of 1.3%), and Indonesian (7.4%, a difference of 1.7%).
| Demographics | Rating | Rank | Unemployment Among Women with Children Ages 6 to 17 years |
| Tongans | 100.0 /100 | #3 | Exceptional 6.7% |
| Ute | 100.0 /100 | #4 | Exceptional 7.0% |
| Okinawans | 100.0 /100 | #5 | Exceptional 7.0% |
| Tlingit-Haida | 100.0 /100 | #6 | Exceptional 7.1% |
| Soviet Union | 100.0 /100 | #7 | Exceptional 7.1% |
| Immigrants | Hong Kong | 100.0 /100 | #8 | Exceptional 7.2% |
| Assyrians/Chaldeans/Syriacs | 100.0 /100 | #9 | Exceptional 7.2% |
| Immigrants | Fiji | 100.0 /100 | #10 | Exceptional 7.3% |
| Immigrants | Taiwan | 100.0 /100 | #11 | Exceptional 7.3% |
| Bangladeshis | 100.0 /100 | #12 | Exceptional 7.4% |
| Indonesians | 100.0 /100 | #13 | Exceptional 7.4% |
| Sudanese | 100.0 /100 | #14 | Exceptional 7.4% |
| Puget Sound Salish | 100.0 /100 | #15 | Exceptional 7.5% |
| Immigrants | Burma/Myanmar | 100.0 /100 | #16 | Exceptional 7.5% |
| Cambodians | 100.0 /100 | #17 | Exceptional 7.5% |
Demographics Similar to Canadians by Unemployment Among Women with Children Ages 6 to 17 years
In terms of unemployment among women with children ages 6 to 17 years, the demographic groups most similar to Canadians are Celtic (9.5%, a difference of 0.020%), Immigrants from Mexico (9.5%, a difference of 0.11%), Lithuanian (9.4%, a difference of 0.17%), Immigrants from Central America (9.5%, a difference of 0.20%), and Nicaraguan (9.4%, a difference of 0.23%).
| Demographics | Rating | Rank | Unemployment Among Women with Children Ages 6 to 17 years |
| Immigrants | South America | 1.5 /100 | #249 | Tragic 9.4% |
| Immigrants | Guatemala | 1.3 /100 | #250 | Tragic 9.4% |
| Central Americans | 1.3 /100 | #251 | Tragic 9.4% |
| Creek | 1.2 /100 | #252 | Tragic 9.4% |
| Portuguese | 1.1 /100 | #253 | Tragic 9.4% |
| Nicaraguans | 1.0 /100 | #254 | Tragic 9.4% |
| Lithuanians | 0.9 /100 | #255 | Tragic 9.4% |
| Canadians | 0.8 /100 | #256 | Tragic 9.4% |
| Celtics | 0.7 /100 | #257 | Tragic 9.5% |
| Immigrants | Mexico | 0.7 /100 | #258 | Tragic 9.5% |
| Immigrants | Central America | 0.6 /100 | #259 | Tragic 9.5% |
| Italians | 0.6 /100 | #260 | Tragic 9.5% |
| South Americans | 0.5 /100 | #261 | Tragic 9.5% |
| Senegalese | 0.5 /100 | #262 | Tragic 9.5% |
| Lebanese | 0.5 /100 | #263 | Tragic 9.5% |