Italian vs Albanian Female Unemployment

COMPARE

Italian
Race
Ancestry
AfghanAfricanAlaska NativeAlaskan AthabascanAleutAlsatianAmericanApacheArabArapahoArgentineanArmenianAssyrian/Chaldean/SyriacAustralianAustrianBahamianBangladeshiBarbadianBasqueBelgianBelizeanBermudanBhutaneseBlackfeetBolivianBrazilianBritishBritish West IndianBulgarianBurmeseCajunCambodianCanadianCape VerdeanCarpatho RusynCelticCentral AmericanCentral American IndianCherokeeCheyenneChickasawChileanChineseChippewaChoctawColombianColvilleComancheCosta RicanCreeCreekCroatianCrowCubanCypriotCzechCzechoslovakianDanishDelawareDominicanDutchDutch West IndianEastern EuropeanEcuadorianEgyptianEnglishEstonianEthiopianEuropeanFijianFilipinoFinnishFrenchFrench American IndianFrench CanadianGermanGerman RussianGhanaianGreekGuamanian/ChamorroGuatemalanGuyaneseHaitianHmongHonduranHopiHoumaHungarianIcelanderIndian (Asian)IndonesianInupiatIranianIraqiIrishIroquoisIsraeliItalianJamaicanJapaneseJordanianKenyanKiowaKoreanLaotianLatvianLebaneseLiberianLithuanianLumbeeLuxembourgerMacedonianMalaysianMalteseMarshalleseMenomineeMexicanMexican American IndianMongolianMoroccanNative HawaiianNavajoNepaleseNew ZealanderNicaraguanNigerianNorthern EuropeanNorwegianOkinawanOsageOttawaPaiutePakistaniPalestinianPanamanianParaguayanPennsylvania GermanPeruvianPimaPolishPortuguesePotawatomiPuebloPuerto RicanPuget Sound SalishRomanianRussianSalvadoranSamoanScandinavianScotch-IrishScottishSeminoleSenegaleseSerbianShoshoneSierra LeoneanSiouxSlavicSlovakSloveneSomaliSouth AfricanSouth AmericanSouth American IndianSoviet UnionSpaniardSpanishSpanish AmericanSpanish American IndianSri LankanSubsaharan AfricanSudaneseSwedishSwissSyrianTaiwaneseThaiTlingit-HaidaTohono O'OdhamTonganTrinidadian and TobagonianTsimshianTurkishU.S. Virgin IslanderUgandanUkrainianUruguayanUteVenezuelanVietnameseWelshWest IndianYakamaYaquiYugoslavianYumanYup'ikZimbabwean
Immigration
NonimmigrantsImmigrantsAfghanistanAfricaAlbaniaArgentinaArmeniaAsiaAustraliaAustriaBahamasBangladeshBarbadosBelarusBelgiumBelizeBoliviaBosnia and HerzegovinaBrazilBulgariaBurma/MyanmarCabo VerdeCambodiaCameroonCanadaCaribbeanCentral AmericaChileChinaColombiaCongoCosta RicaCroatiaCubaCzechoslovakiaDenmarkDominicaDominican RepublicEastern AfricaEastern AsiaEastern EuropeEcuadorEgyptEl SalvadorEnglandEritreaEthiopiaEuropeFijiFranceGermanyGhanaGreeceGrenadaGuatemalaGuyanaHaitiHondurasHong KongHungaryIndiaIndonesiaIranIraqIrelandIsraelItalyJamaicaJapanJordanKazakhstanKenyaKoreaKuwaitLaosLatin AmericaLatviaLebanonLiberiaLithuaniaMalaysiaMexicoMicronesiaMiddle AfricaMoldovaMoroccoNepalNetherlandsNicaraguaNigeriaNorth AmericaNorth MacedoniaNorthern AfricaNorthern EuropeNorwayOceaniaPakistanPanamaPeruPhilippinesPolandPortugalRomaniaRussiaSaudi ArabiaScotlandSenegalSerbiaSierra LeoneSingaporeSomaliaSouth AfricaSouth AmericaSouth Central AsiaSouth Eastern AsiaSouthern EuropeSpainSri LankaSt. Vincent and the GrenadinesSudanSwedenSwitzerlandSyriaTaiwanThailandTrinidad and TobagoTurkeyUgandaUkraineUruguayUzbekistanVenezuelaVietnamWest IndiesWestern AfricaWestern AsiaWestern EuropeYemenZaireZimbabweAzores
Albanian
Race
Ancestry
AfghanAfricanAlaska NativeAlaskan AthabascanAlbanianAleutAlsatianAmericanApacheArabArapahoArgentineanArmenianAssyrian/Chaldean/SyriacAustralianAustrianBahamianBangladeshiBarbadianBasqueBelgianBelizeanBermudanBhutaneseBlackfeetBolivianBrazilianBritishBritish West IndianBulgarianBurmeseCajunCambodianCanadianCape VerdeanCarpatho RusynCelticCentral AmericanCentral American IndianCherokeeCheyenneChickasawChileanChineseChippewaChoctawColombianColvilleComancheCosta RicanCreeCreekCroatianCrowCubanCypriotCzechCzechoslovakianDanishDelawareDominicanDutchDutch West IndianEastern EuropeanEcuadorianEgyptianEnglishEstonianEthiopianEuropeanFijianFilipinoFinnishFrenchFrench American IndianFrench CanadianGermanGerman RussianGhanaianGreekGuamanian/ChamorroGuatemalanGuyaneseHaitianHmongHonduranHopiHoumaHungarianIcelanderIndian (Asian)IndonesianInupiatIranianIraqiIrishIroquoisIsraeliJamaicanJapaneseJordanianKenyanKiowaKoreanLaotianLatvianLebaneseLiberianLithuanianLumbeeLuxembourgerMacedonianMalaysianMalteseMarshalleseMenomineeMexicanMexican American IndianMongolianMoroccanNative HawaiianNavajoNepaleseNew ZealanderNicaraguanNigerianNorthern EuropeanNorwegianOkinawanOsageOttawaPaiutePakistaniPalestinianPanamanianParaguayanPennsylvania GermanPeruvianPimaPolishPortuguesePotawatomiPuebloPuerto RicanPuget Sound SalishRomanianRussianSalvadoranSamoanScandinavianScotch-IrishScottishSeminoleSenegaleseSerbianShoshoneSierra LeoneanSiouxSlavicSlovakSloveneSomaliSouth AfricanSouth AmericanSouth American IndianSoviet UnionSpaniardSpanishSpanish AmericanSpanish American IndianSri LankanSubsaharan AfricanSudaneseSwedishSwissSyrianTaiwaneseThaiTlingit-HaidaTohono O'OdhamTonganTrinidadian and TobagonianTsimshianTurkishU.S. Virgin IslanderUgandanUkrainianUruguayanUteVenezuelanVietnameseWelshWest IndianYakamaYaquiYugoslavianYumanYup'ikZimbabwean
Immigration
NonimmigrantsImmigrantsAfghanistanAfricaAlbaniaArgentinaArmeniaAsiaAustraliaAustriaBahamasBangladeshBarbadosBelarusBelgiumBelizeBoliviaBosnia and HerzegovinaBrazilBulgariaBurma/MyanmarCabo VerdeCambodiaCameroonCanadaCaribbeanCentral AmericaChileChinaColombiaCongoCosta RicaCroatiaCubaCzechoslovakiaDenmarkDominicaDominican RepublicEastern AfricaEastern AsiaEastern EuropeEcuadorEgyptEl SalvadorEnglandEritreaEthiopiaEuropeFijiFranceGermanyGhanaGreeceGrenadaGuatemalaGuyanaHaitiHondurasHong KongHungaryIndiaIndonesiaIranIraqIrelandIsraelItalyJamaicaJapanJordanKazakhstanKenyaKoreaKuwaitLaosLatin AmericaLatviaLebanonLiberiaLithuaniaMalaysiaMexicoMicronesiaMiddle AfricaMoldovaMoroccoNepalNetherlandsNicaraguaNigeriaNorth AmericaNorth MacedoniaNorthern AfricaNorthern EuropeNorwayOceaniaPakistanPanamaPeruPhilippinesPolandPortugalRomaniaRussiaSaudi ArabiaScotlandSenegalSerbiaSierra LeoneSingaporeSomaliaSouth AfricaSouth AmericaSouth Central AsiaSouth Eastern AsiaSouthern EuropeSpainSri LankaSt. Vincent and the GrenadinesSudanSwedenSwitzerlandSyriaTaiwanThailandTrinidad and TobagoTurkeyUgandaUkraineUruguayUzbekistanVenezuelaVietnamWest IndiesWestern AfricaWestern AsiaWestern EuropeYemenZaireZimbabweAzores
Female Unemployment
Income
Poverty
Unemployment
Labor Participation
Family Structure
Vehicle Availability
Education Level
Disability

Female Unemployment Comparison

Italians

Albanians

Exceptional
Good
4.8%
FEMALE UNEMPLOYMENT
99.5/ 100
METRIC RATING
42nd/ 347
METRIC RANK
5.2%
FEMALE UNEMPLOYMENT
68.3/ 100
METRIC RATING
158th/ 347
METRIC RANK

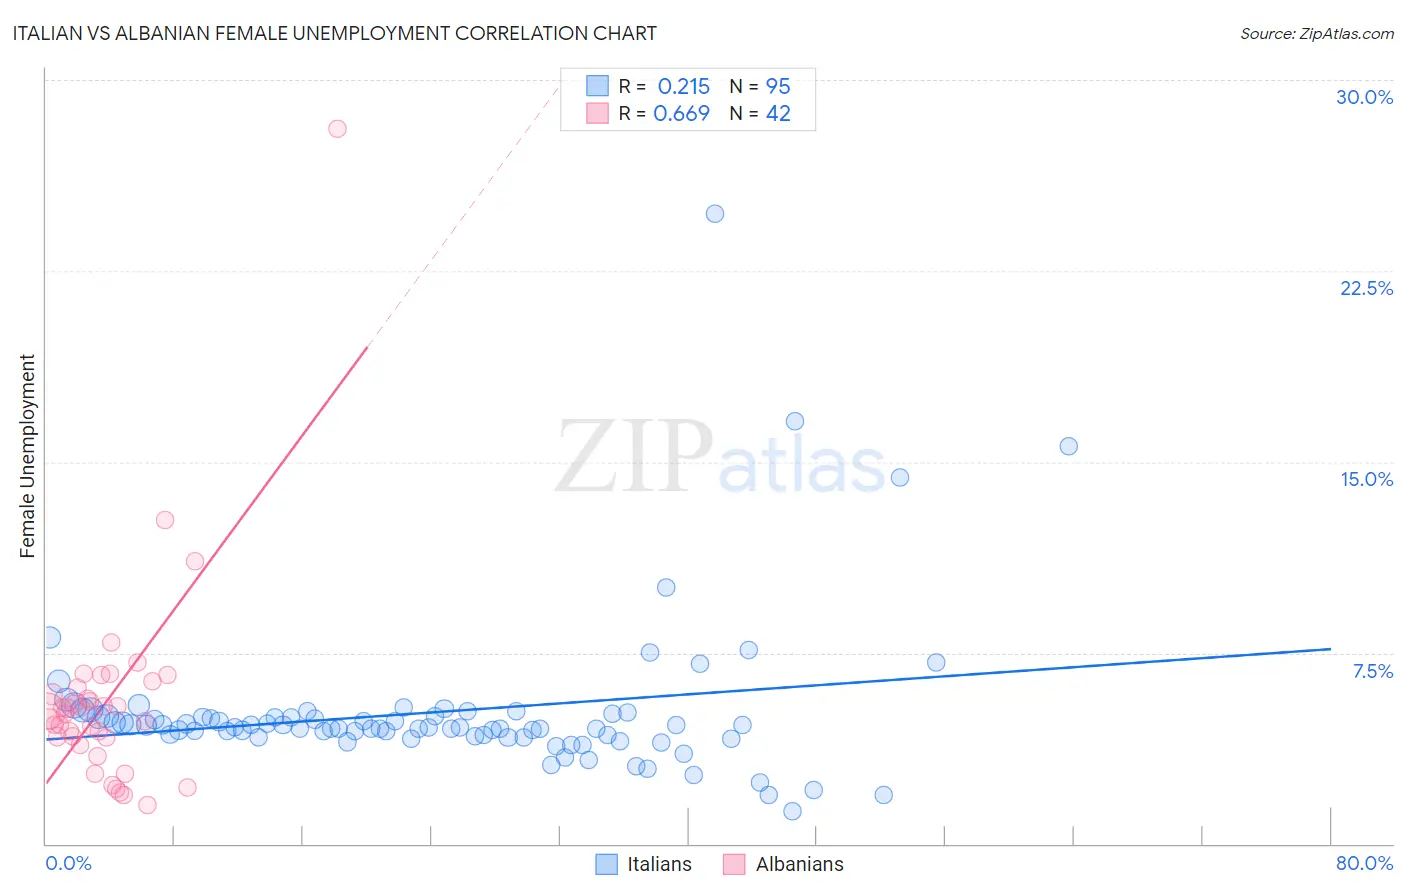
Italian vs Albanian Female Unemployment Correlation Chart

The statistical analysis conducted on geographies consisting of 560,779,263 people shows a weak positive correlation between the proportion of Italians and unemploymnet rate among females in the United States with a correlation coefficient (R) of 0.215 and weighted average of 4.8%. Similarly, the statistical analysis conducted on geographies consisting of 192,822,109 people shows a significant positive correlation between the proportion of Albanians and unemploymnet rate among females in the United States with a correlation coefficient (R) of 0.669 and weighted average of 5.2%, a difference of 7.3%.
Italian vs Albanian Female Unemployment

Female Unemployment Correlation Summary

MeasurementItalianAlbanian
Minimum1.3%1.5%
Maximum24.8%28.1%
Range23.5%26.6%
Mean5.2%5.6%
Median4.6%5.2%
Interquartile 25% (IQ1)4.2%4.2%
Interquartile 75% (IQ3)5.0%6.1%
Interquartile Range (IQR)0.79%1.9%
Standard Deviation (Sample)3.1%4.2%
Standard Deviation (Population)3.0%4.1%

Similar Demographics by Female Unemployment

Demographics Similar to Italians by Female Unemployment

In terms of female unemployment, the demographic groups most similar to Italians are Tongan (4.8%, a difference of 0.13%), Eastern European (4.9%, a difference of 0.17%), Greek (4.9%, a difference of 0.28%), Austrian (4.9%, a difference of 0.36%), and Immigrants from Bulgaria (4.9%, a difference of 0.38%).
DemographicsRating | RankFemale Unemployment
French Canadians
99.7
/100
|
#35
Exceptional
4.8%
Yugoslavians
99.7
/100
|
#36
Exceptional
4.8%
Pennsylvania Germans
99.6
/100
|
#37
Exceptional
4.8%
Northern Europeans
99.6
/100
|
#38
Exceptional
4.8%
Scotch-Irish
99.6
/100
|
#39
Exceptional
4.8%
French
99.6
/100
|
#40
Exceptional
4.8%
Tongans
99.5
/100
|
#41
Exceptional
4.8%
Italians
99.5
/100
|
#42
Exceptional
4.8%
Eastern Europeans
99.4
/100
|
#43
Exceptional
4.9%
Greeks
99.4
/100
|
#44
Exceptional
4.9%
Austrians
99.3
/100
|
#45
Exceptional
4.9%
Immigrants | Bulgaria
99.3
/100
|
#46
Exceptional
4.9%
Okinawans
99.3
/100
|
#47
Exceptional
4.9%
Thais
99.2
/100
|
#48
Exceptional
4.9%
Australians
99.2
/100
|
#49
Exceptional
4.9%

Demographics Similar to Albanians by Female Unemployment

In terms of female unemployment, the demographic groups most similar to Albanians are Immigrants from Russia (5.2%, a difference of 0.070%), Immigrants from Northern Africa (5.2%, a difference of 0.10%), Immigrants from Micronesia (5.2%, a difference of 0.10%), Immigrants from Spain (5.2%, a difference of 0.11%), and Immigrants from Pakistan (5.2%, a difference of 0.11%).
DemographicsRating | RankFemale Unemployment
Immigrants | China
75.9
/100
|
#151
Good
5.2%
Immigrants | Italy
75.0
/100
|
#152
Good
5.2%
Immigrants | Greece
74.9
/100
|
#153
Good
5.2%
South Africans
70.8
/100
|
#154
Good
5.2%
Immigrants | Egypt
70.0
/100
|
#155
Good
5.2%
Immigrants | Northern Africa
69.6
/100
|
#156
Good
5.2%
Immigrants | Russia
69.3
/100
|
#157
Good
5.2%
Albanians
68.3
/100
|
#158
Good
5.2%
Immigrants | Micronesia
66.9
/100
|
#159
Good
5.2%
Immigrants | Spain
66.8
/100
|
#160
Good
5.2%
Immigrants | Pakistan
66.7
/100
|
#161
Good
5.2%
Potawatomi
65.9
/100
|
#162
Good
5.2%
Immigrants | Asia
64.3
/100
|
#163
Good
5.2%
Bangladeshis
64.3
/100
|
#164
Good
5.2%
Syrians
62.8
/100
|
#165
Good
5.2%