Irish vs Immigrants from Pakistan Unemployment Among Women with Children Ages 6 to 17 years
COMPARE
Irish
Immigrants from Pakistan
Unemployment Among Women with Children Ages 6 to 17 years
Unemployment Among Women with Children Ages 6 to 17 years Comparison
Irish
Immigrants from Pakistan
9.5%
UNEMPLOYMENT AMONG WOMEN WITH CHILDREN AGES 6 TO 17 YEARS
0.3/ 100
METRIC RATING
267th/ 347
METRIC RANK
8.6%
UNEMPLOYMENT AMONG WOMEN WITH CHILDREN AGES 6 TO 17 YEARS
98.4/ 100
METRIC RATING
101st/ 347
METRIC RANK
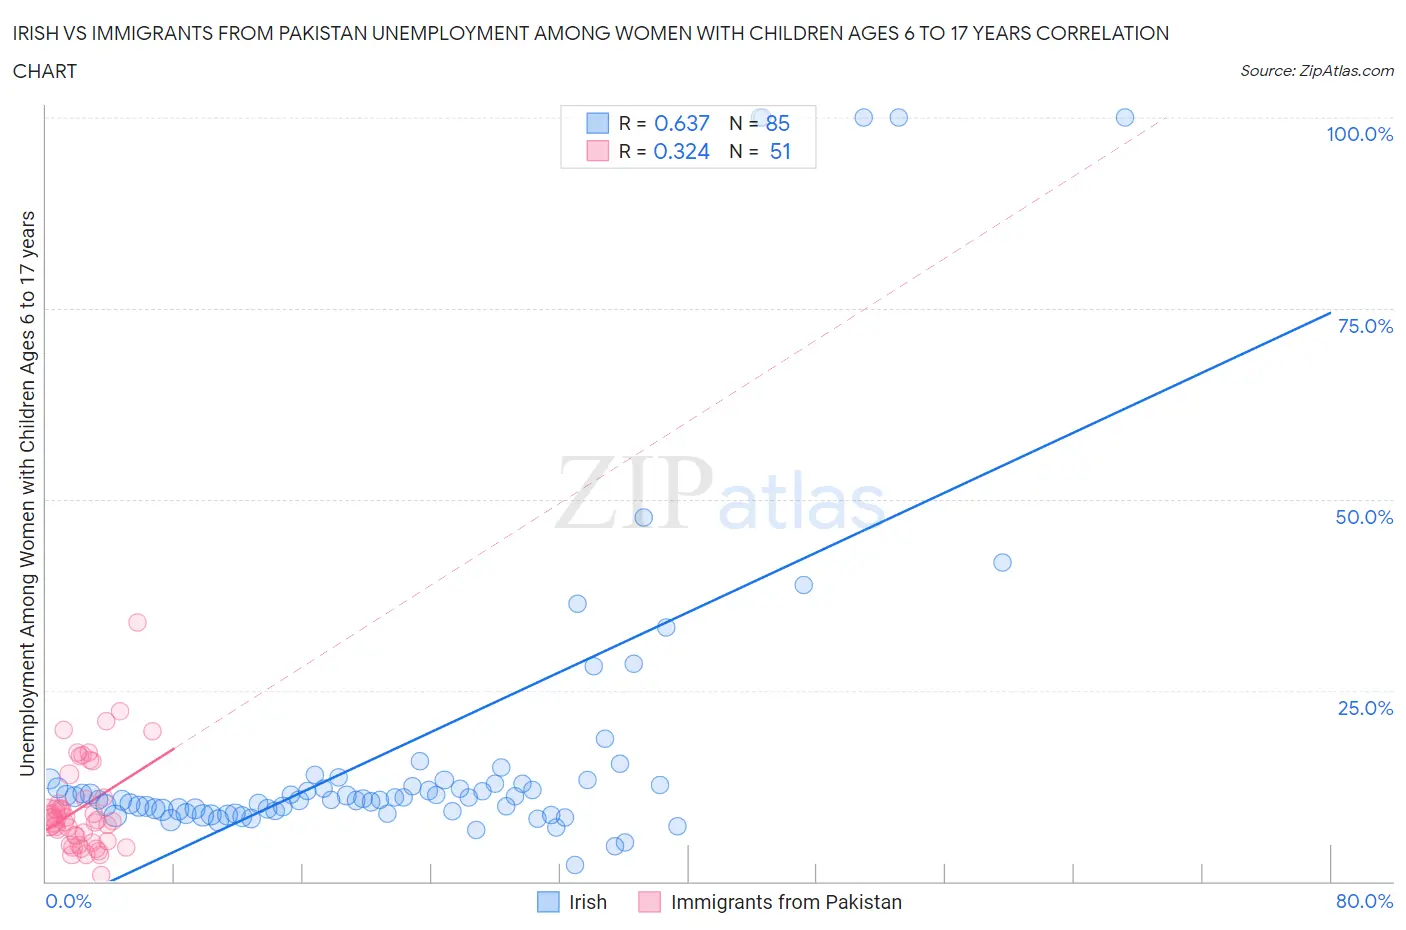
Irish vs Immigrants from Pakistan Unemployment Among Women with Children Ages 6 to 17 years Correlation Chart
The statistical analysis conducted on geographies consisting of 359,522,437 people shows a significant positive correlation between the proportion of Irish and unemployment rate among women with children between the ages 6 and 17 in the United States with a correlation coefficient (R) of 0.637 and weighted average of 9.5%. Similarly, the statistical analysis conducted on geographies consisting of 220,163,438 people shows a mild positive correlation between the proportion of Immigrants from Pakistan and unemployment rate among women with children between the ages 6 and 17 in the United States with a correlation coefficient (R) of 0.324 and weighted average of 8.6%, a difference of 11.5%.
Unemployment Among Women with Children Ages 6 to 17 years Correlation Summary
| Measurement | Irish | Immigrants from Pakistan |
| Minimum | 2.1% | 0.80% |
| Maximum | 100.0% | 33.8% |
| Range | 97.9% | 33.0% |
| Mean | 17.8% | 9.7% |
| Median | 10.9% | 8.0% |
| Interquartile 25% (IQ1) | 9.2% | 5.3% |
| Interquartile 75% (IQ3) | 13.0% | 11.0% |
| Interquartile Range (IQR) | 3.8% | 5.7% |
| Standard Deviation (Sample) | 22.1% | 6.1% |
| Standard Deviation (Population) | 21.9% | 6.1% |
Similar Demographics by Unemployment Among Women with Children Ages 6 to 17 years
Demographics Similar to Irish by Unemployment Among Women with Children Ages 6 to 17 years
In terms of unemployment among women with children ages 6 to 17 years, the demographic groups most similar to Irish are Immigrants from Jamaica (9.5%, a difference of 0.020%), West Indian (9.5%, a difference of 0.18%), Immigrants from Ghana (9.5%, a difference of 0.21%), Ghanaian (9.6%, a difference of 0.39%), and Lebanese (9.5%, a difference of 0.45%).
| Demographics | Rating | Rank | Unemployment Among Women with Children Ages 6 to 17 years |
| Italians | 0.6 /100 | #260 | Tragic 9.5% |
| South Americans | 0.5 /100 | #261 | Tragic 9.5% |
| Senegalese | 0.5 /100 | #262 | Tragic 9.5% |
| Lebanese | 0.5 /100 | #263 | Tragic 9.5% |
| Immigrants | Ghana | 0.4 /100 | #264 | Tragic 9.5% |
| West Indians | 0.4 /100 | #265 | Tragic 9.5% |
| Immigrants | Jamaica | 0.3 /100 | #266 | Tragic 9.5% |
| Irish | 0.3 /100 | #267 | Tragic 9.5% |
| Ghanaians | 0.2 /100 | #268 | Tragic 9.6% |
| Blackfeet | 0.2 /100 | #269 | Tragic 9.6% |
| Immigrants | Nicaragua | 0.2 /100 | #270 | Tragic 9.6% |
| Immigrants | Latin America | 0.1 /100 | #271 | Tragic 9.6% |
| Kiowa | 0.1 /100 | #272 | Tragic 9.6% |
| Whites/Caucasians | 0.1 /100 | #273 | Tragic 9.6% |
| Aleuts | 0.1 /100 | #274 | Tragic 9.6% |
Demographics Similar to Immigrants from Pakistan by Unemployment Among Women with Children Ages 6 to 17 years
In terms of unemployment among women with children ages 6 to 17 years, the demographic groups most similar to Immigrants from Pakistan are Immigrants from Lithuania (8.6%, a difference of 0.0%), New Zealander (8.6%, a difference of 0.0%), Immigrants from South Africa (8.6%, a difference of 0.020%), Scandinavian (8.6%, a difference of 0.030%), and Malaysian (8.6%, a difference of 0.080%).
| Demographics | Rating | Rank | Unemployment Among Women with Children Ages 6 to 17 years |
| Immigrants | Barbados | 98.8 /100 | #94 | Exceptional 8.5% |
| Sri Lankans | 98.7 /100 | #95 | Exceptional 8.5% |
| German Russians | 98.6 /100 | #96 | Exceptional 8.5% |
| Bolivians | 98.5 /100 | #97 | Exceptional 8.5% |
| Malaysians | 98.5 /100 | #98 | Exceptional 8.6% |
| Immigrants | Lithuania | 98.4 /100 | #99 | Exceptional 8.6% |
| New Zealanders | 98.4 /100 | #100 | Exceptional 8.6% |
| Immigrants | Pakistan | 98.4 /100 | #101 | Exceptional 8.6% |
| Immigrants | South Africa | 98.3 /100 | #102 | Exceptional 8.6% |
| Scandinavians | 98.3 /100 | #103 | Exceptional 8.6% |
| Immigrants | France | 98.0 /100 | #104 | Exceptional 8.6% |
| Immigrants | Norway | 97.8 /100 | #105 | Exceptional 8.6% |
| Immigrants | Serbia | 97.7 /100 | #106 | Exceptional 8.6% |
| Chickasaw | 97.6 /100 | #107 | Exceptional 8.6% |
| Swedes | 97.6 /100 | #108 | Exceptional 8.6% |