Armenian vs Immigrants from Liberia Unemployment Among Women with Children Ages 6 to 17 years
COMPARE
Armenian
Immigrants from Liberia
Unemployment Among Women with Children Ages 6 to 17 years
Unemployment Among Women with Children Ages 6 to 17 years Comparison
Armenians
Immigrants from Liberia
8.3%
UNEMPLOYMENT AMONG WOMEN WITH CHILDREN AGES 6 TO 17 YEARS
99.9/ 100
METRIC RATING
67th/ 347
METRIC RANK
10.3%
UNEMPLOYMENT AMONG WOMEN WITH CHILDREN AGES 6 TO 17 YEARS
0.0/ 100
METRIC RATING
311th/ 347
METRIC RANK
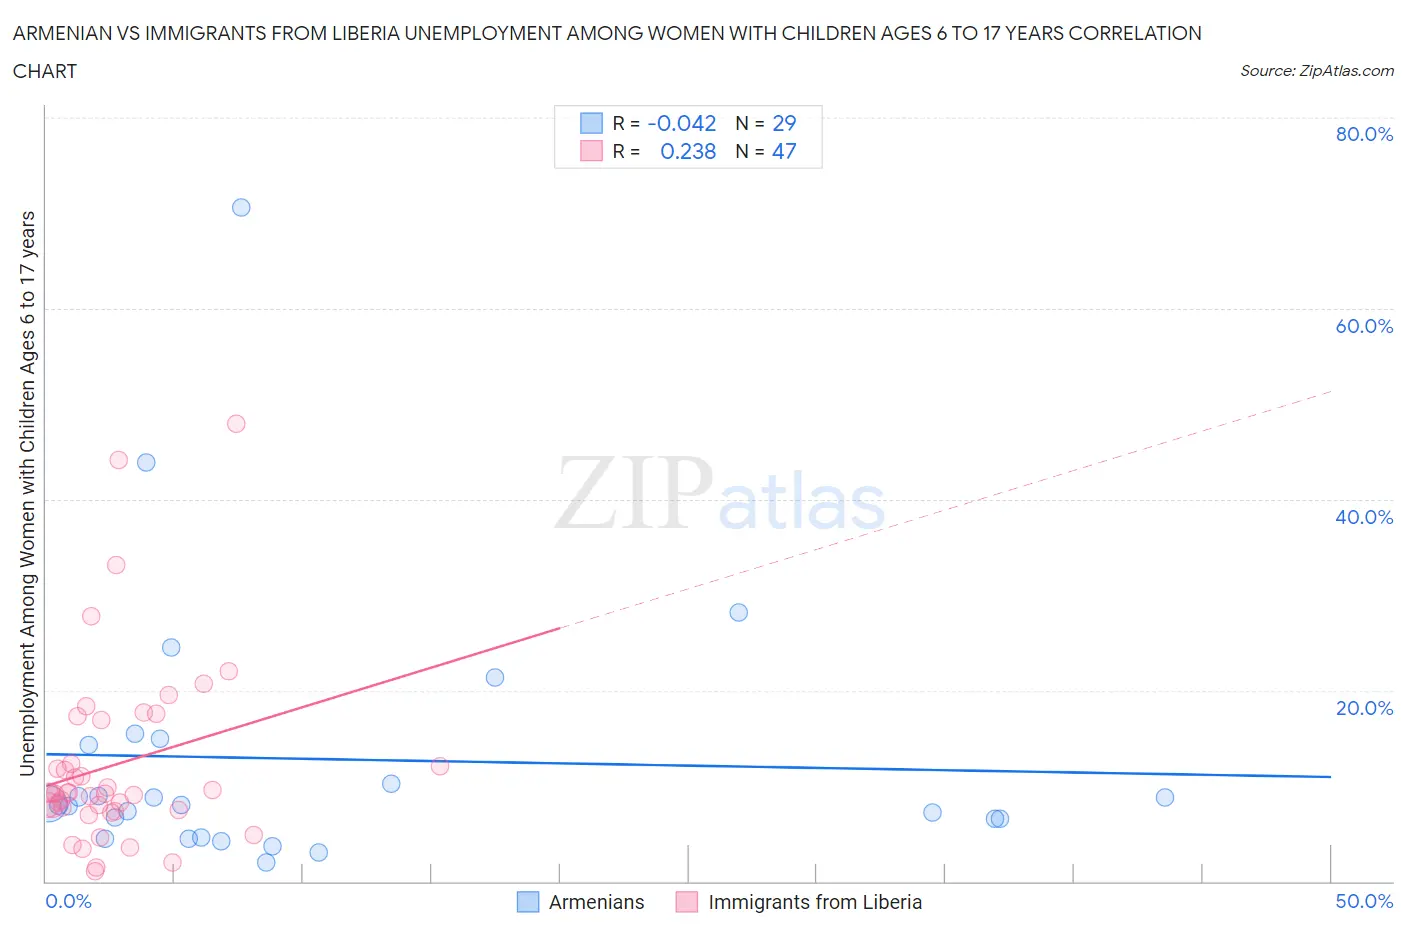
Armenian vs Immigrants from Liberia Unemployment Among Women with Children Ages 6 to 17 years Correlation Chart
The statistical analysis conducted on geographies consisting of 229,483,477 people shows no correlation between the proportion of Armenians and unemployment rate among women with children between the ages 6 and 17 in the United States with a correlation coefficient (R) of -0.042 and weighted average of 8.3%. Similarly, the statistical analysis conducted on geographies consisting of 118,003,390 people shows a weak positive correlation between the proportion of Immigrants from Liberia and unemployment rate among women with children between the ages 6 and 17 in the United States with a correlation coefficient (R) of 0.238 and weighted average of 10.3%, a difference of 24.3%.
Unemployment Among Women with Children Ages 6 to 17 years Correlation Summary
| Measurement | Armenian | Immigrants from Liberia |
| Minimum | 1.9% | 1.0% |
| Maximum | 70.6% | 47.9% |
| Range | 68.7% | 46.9% |
| Mean | 12.8% | 12.2% |
| Median | 8.0% | 9.2% |
| Interquartile 25% (IQ1) | 5.6% | 7.5% |
| Interquartile 75% (IQ3) | 14.6% | 16.9% |
| Interquartile Range (IQR) | 9.0% | 9.4% |
| Standard Deviation (Sample) | 14.2% | 9.7% |
| Standard Deviation (Population) | 14.0% | 9.6% |
Similar Demographics by Unemployment Among Women with Children Ages 6 to 17 years
Demographics Similar to Armenians by Unemployment Among Women with Children Ages 6 to 17 years
In terms of unemployment among women with children ages 6 to 17 years, the demographic groups most similar to Armenians are Marshallese (8.3%, a difference of 0.080%), Luxembourger (8.3%, a difference of 0.10%), Immigrants from Thailand (8.3%, a difference of 0.11%), Norwegian (8.3%, a difference of 0.19%), and Immigrants from Albania (8.3%, a difference of 0.23%).
| Demographics | Rating | Rank | Unemployment Among Women with Children Ages 6 to 17 years |
| Basques | 100.0 /100 | #60 | Exceptional 8.2% |
| Koreans | 100.0 /100 | #61 | Exceptional 8.2% |
| Spanish American Indians | 100.0 /100 | #62 | Exceptional 8.2% |
| Immigrants | South Eastern Asia | 99.9 /100 | #63 | Exceptional 8.2% |
| Immigrants | Kuwait | 99.9 /100 | #64 | Exceptional 8.3% |
| Immigrants | Albania | 99.9 /100 | #65 | Exceptional 8.3% |
| Luxembourgers | 99.9 /100 | #66 | Exceptional 8.3% |
| Armenians | 99.9 /100 | #67 | Exceptional 8.3% |
| Marshallese | 99.9 /100 | #68 | Exceptional 8.3% |
| Immigrants | Thailand | 99.9 /100 | #69 | Exceptional 8.3% |
| Norwegians | 99.9 /100 | #70 | Exceptional 8.3% |
| Immigrants | Australia | 99.8 /100 | #71 | Exceptional 8.3% |
| Immigrants | Nepal | 99.8 /100 | #72 | Exceptional 8.3% |
| Spanish Americans | 99.8 /100 | #73 | Exceptional 8.4% |
| Samoans | 99.7 /100 | #74 | Exceptional 8.4% |
Demographics Similar to Immigrants from Liberia by Unemployment Among Women with Children Ages 6 to 17 years
In terms of unemployment among women with children ages 6 to 17 years, the demographic groups most similar to Immigrants from Liberia are Alaska Native (10.3%, a difference of 0.030%), French Canadian (10.3%, a difference of 0.080%), Dutch West Indian (10.2%, a difference of 0.62%), Immigrants from Senegal (10.2%, a difference of 0.63%), and African (10.4%, a difference of 0.84%).
| Demographics | Rating | Rank | Unemployment Among Women with Children Ages 6 to 17 years |
| Immigrants | Venezuela | 0.0 /100 | #304 | Tragic 10.2% |
| Immigrants | Nigeria | 0.0 /100 | #305 | Tragic 10.2% |
| Paraguayans | 0.0 /100 | #306 | Tragic 10.2% |
| Immigrants | Senegal | 0.0 /100 | #307 | Tragic 10.2% |
| Dutch West Indians | 0.0 /100 | #308 | Tragic 10.2% |
| French Canadians | 0.0 /100 | #309 | Tragic 10.3% |
| Alaska Natives | 0.0 /100 | #310 | Tragic 10.3% |
| Immigrants | Liberia | 0.0 /100 | #311 | Tragic 10.3% |
| Africans | 0.0 /100 | #312 | Tragic 10.4% |
| Americans | 0.0 /100 | #313 | Tragic 10.4% |
| Immigrants | Cabo Verde | 0.0 /100 | #314 | Tragic 10.4% |
| Bahamians | 0.0 /100 | #315 | Tragic 10.4% |
| Immigrants | Dominica | 0.0 /100 | #316 | Tragic 10.5% |
| Bermudans | 0.0 /100 | #317 | Tragic 10.5% |
| Delaware | 0.0 /100 | #318 | Tragic 10.5% |