Central American vs Immigrants from Switzerland Male Unemployment
COMPARE
Central American
Immigrants from Switzerland
Male Unemployment
Male Unemployment Comparison
Central Americans
Immigrants from Switzerland
5.6%
MALE UNEMPLOYMENT
1.8/ 100
METRIC RATING
229th/ 347
METRIC RANK
5.2%
MALE UNEMPLOYMENT
79.2/ 100
METRIC RATING
141st/ 347
METRIC RANK
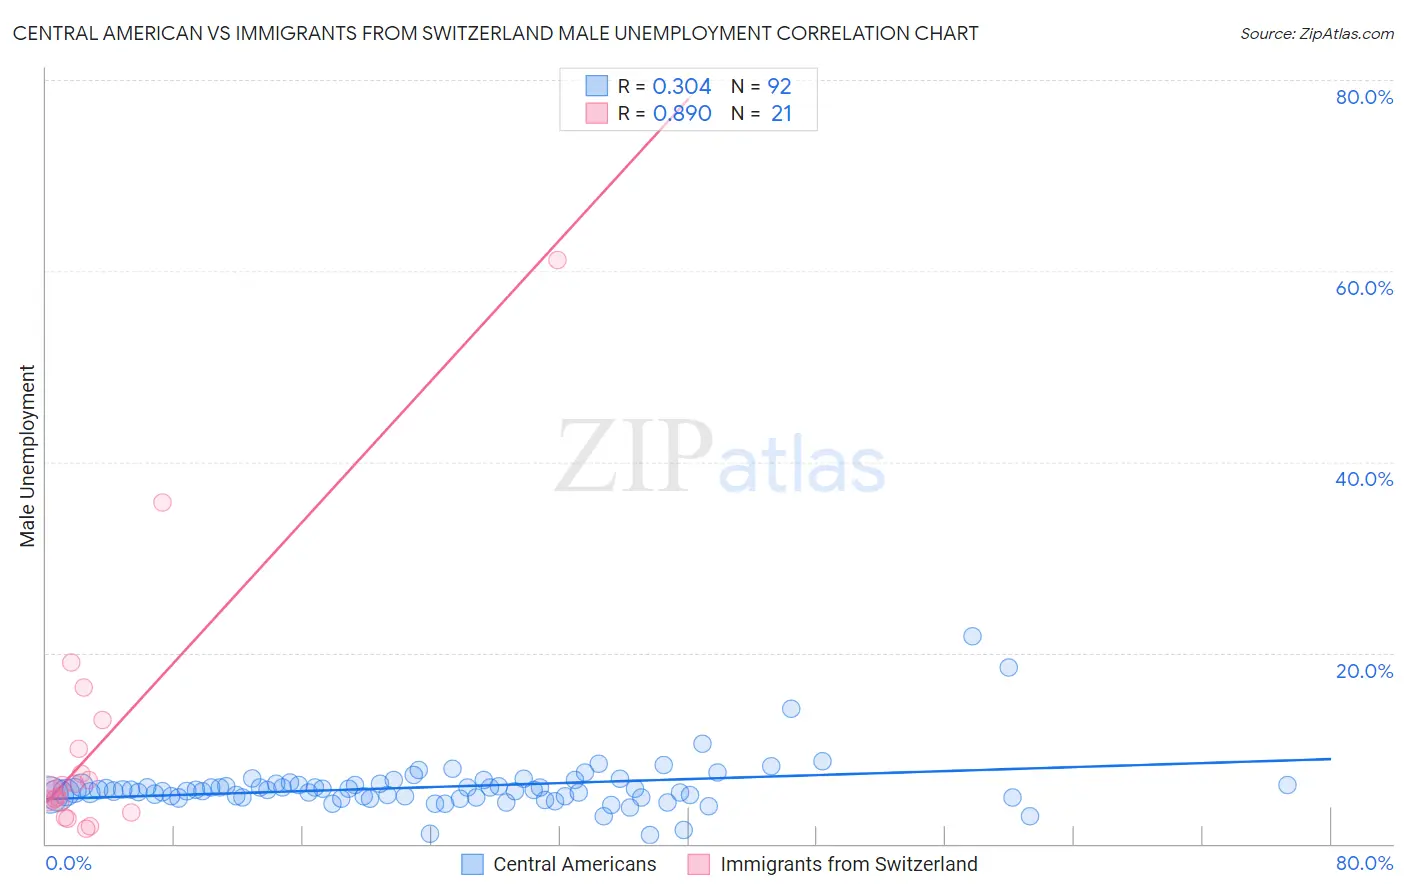
Central American vs Immigrants from Switzerland Male Unemployment Correlation Chart
The statistical analysis conducted on geographies consisting of 500,623,781 people shows a mild positive correlation between the proportion of Central Americans and unemployment rate among males in the United States with a correlation coefficient (R) of 0.304 and weighted average of 5.6%. Similarly, the statistical analysis conducted on geographies consisting of 147,847,273 people shows a very strong positive correlation between the proportion of Immigrants from Switzerland and unemployment rate among males in the United States with a correlation coefficient (R) of 0.890 and weighted average of 5.2%, a difference of 8.0%.
Male Unemployment Correlation Summary
| Measurement | Central American | Immigrants from Switzerland |
| Minimum | 0.90% | 1.6% |
| Maximum | 21.7% | 61.1% |
| Range | 20.8% | 59.5% |
| Mean | 5.9% | 10.6% |
| Median | 5.6% | 5.6% |
| Interquartile 25% (IQ1) | 4.9% | 3.8% |
| Interquartile 75% (IQ3) | 6.2% | 11.5% |
| Interquartile Range (IQR) | 1.3% | 7.7% |
| Standard Deviation (Sample) | 2.7% | 13.9% |
| Standard Deviation (Population) | 2.7% | 13.6% |
Similar Demographics by Male Unemployment
Demographics Similar to Central Americans by Male Unemployment
In terms of male unemployment, the demographic groups most similar to Central Americans are Seminole (5.6%, a difference of 0.0%), Immigrants from Panama (5.6%, a difference of 0.020%), Immigrants from Cambodia (5.6%, a difference of 0.030%), Immigrants from Africa (5.6%, a difference of 0.040%), and Choctaw (5.6%, a difference of 0.090%).
| Demographics | Rating | Rank | Male Unemployment |
| Immigrants | Micronesia | 2.9 /100 | #222 | Tragic 5.6% |
| Creek | 2.6 /100 | #223 | Tragic 5.6% |
| Cherokee | 2.4 /100 | #224 | Tragic 5.6% |
| Panamanians | 1.9 /100 | #225 | Tragic 5.6% |
| Immigrants | Cambodia | 1.8 /100 | #226 | Tragic 5.6% |
| Immigrants | Panama | 1.8 /100 | #227 | Tragic 5.6% |
| Seminole | 1.8 /100 | #228 | Tragic 5.6% |
| Central Americans | 1.8 /100 | #229 | Tragic 5.6% |
| Immigrants | Africa | 1.7 /100 | #230 | Tragic 5.6% |
| Choctaw | 1.6 /100 | #231 | Tragic 5.6% |
| Moroccans | 1.6 /100 | #232 | Tragic 5.6% |
| Somalis | 1.5 /100 | #233 | Tragic 5.6% |
| Immigrants | Somalia | 1.5 /100 | #234 | Tragic 5.6% |
| Immigrants | Honduras | 1.5 /100 | #235 | Tragic 5.6% |
| Guatemalans | 1.2 /100 | #236 | Tragic 5.6% |
Demographics Similar to Immigrants from Switzerland by Male Unemployment
In terms of male unemployment, the demographic groups most similar to Immigrants from Switzerland are Brazilian (5.2%, a difference of 0.010%), Kenyan (5.2%, a difference of 0.020%), Immigrants from Croatia (5.2%, a difference of 0.040%), Immigrants from Eastern Africa (5.2%, a difference of 0.050%), and Lebanese (5.2%, a difference of 0.060%).
| Demographics | Rating | Rank | Male Unemployment |
| Pakistanis | 80.5 /100 | #134 | Excellent 5.2% |
| Immigrants | Saudi Arabia | 80.1 /100 | #135 | Excellent 5.2% |
| Lebanese | 79.9 /100 | #136 | Good 5.2% |
| Immigrants | Eastern Africa | 79.8 /100 | #137 | Good 5.2% |
| Immigrants | Croatia | 79.7 /100 | #138 | Good 5.2% |
| Kenyans | 79.4 /100 | #139 | Good 5.2% |
| Brazilians | 79.3 /100 | #140 | Good 5.2% |
| Immigrants | Switzerland | 79.2 /100 | #141 | Good 5.2% |
| Fijians | 78.3 /100 | #142 | Good 5.2% |
| Syrians | 78.0 /100 | #143 | Good 5.2% |
| Sri Lankans | 77.9 /100 | #144 | Good 5.2% |
| Macedonians | 77.7 /100 | #145 | Good 5.2% |
| Immigrants | Kenya | 77.6 /100 | #146 | Good 5.2% |
| Immigrants | Burma/Myanmar | 77.5 /100 | #147 | Good 5.2% |
| Immigrants | Italy | 76.3 /100 | #148 | Good 5.2% |