Iraqi vs Scottish Male Unemployment
COMPARE
Iraqi
Scottish
Male Unemployment
Male Unemployment Comparison
Iraqis
Scottish
5.4%
MALE UNEMPLOYMENT
31.6/ 100
METRIC RATING
186th/ 347
METRIC RANK
4.8%
MALE UNEMPLOYMENT
99.8/ 100
METRIC RATING
29th/ 347
METRIC RANK
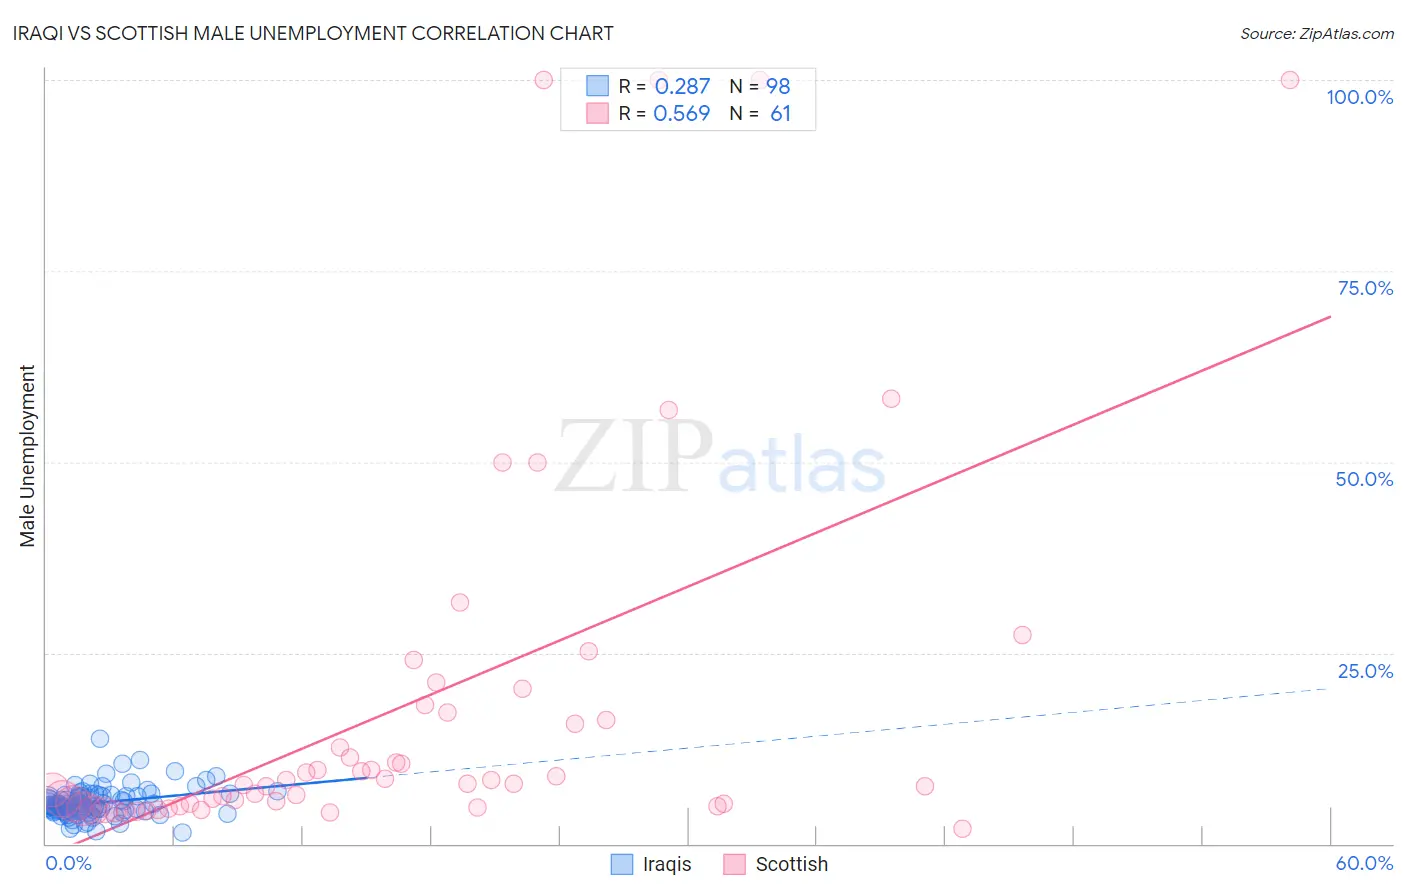
Iraqi vs Scottish Male Unemployment Correlation Chart
The statistical analysis conducted on geographies consisting of 170,532,331 people shows a weak positive correlation between the proportion of Iraqis and unemployment rate among males in the United States with a correlation coefficient (R) of 0.287 and weighted average of 5.4%. Similarly, the statistical analysis conducted on geographies consisting of 556,190,347 people shows a substantial positive correlation between the proportion of Scottish and unemployment rate among males in the United States with a correlation coefficient (R) of 0.569 and weighted average of 4.8%, a difference of 11.5%.
Male Unemployment Correlation Summary
| Measurement | Iraqi | Scottish |
| Minimum | 1.4% | 1.9% |
| Maximum | 13.8% | 100.0% |
| Range | 12.4% | 98.1% |
| Mean | 5.4% | 18.3% |
| Median | 4.9% | 7.9% |
| Interquartile 25% (IQ1) | 4.2% | 5.1% |
| Interquartile 75% (IQ3) | 6.3% | 17.7% |
| Interquartile Range (IQR) | 2.1% | 12.6% |
| Standard Deviation (Sample) | 1.9% | 25.2% |
| Standard Deviation (Population) | 1.9% | 25.0% |
Similar Demographics by Male Unemployment
Demographics Similar to Iraqis by Male Unemployment
In terms of male unemployment, the demographic groups most similar to Iraqis are Costa Rican (5.4%, a difference of 0.010%), Arab (5.4%, a difference of 0.090%), Immigrants from South America (5.4%, a difference of 0.15%), Immigrants from Uganda (5.4%, a difference of 0.19%), and Korean (5.3%, a difference of 0.22%).
| Demographics | Rating | Rank | Male Unemployment |
| Immigrants | Oceania | 40.8 /100 | #179 | Average 5.3% |
| Malaysians | 39.6 /100 | #180 | Fair 5.3% |
| Immigrants | Afghanistan | 37.9 /100 | #181 | Fair 5.3% |
| Potawatomi | 37.8 /100 | #182 | Fair 5.3% |
| Taiwanese | 37.6 /100 | #183 | Fair 5.3% |
| Spaniards | 35.1 /100 | #184 | Fair 5.3% |
| Koreans | 34.9 /100 | #185 | Fair 5.3% |
| Iraqis | 31.6 /100 | #186 | Fair 5.4% |
| Costa Ricans | 31.3 /100 | #187 | Fair 5.4% |
| Arabs | 30.2 /100 | #188 | Fair 5.4% |
| Immigrants | South America | 29.4 /100 | #189 | Fair 5.4% |
| Immigrants | Uganda | 28.8 /100 | #190 | Fair 5.4% |
| Immigrants | South Eastern Asia | 28.2 /100 | #191 | Fair 5.4% |
| Immigrants | Belarus | 26.0 /100 | #192 | Fair 5.4% |
| Immigrants | Israel | 25.2 /100 | #193 | Fair 5.4% |
Demographics Similar to Scottish by Male Unemployment
In terms of male unemployment, the demographic groups most similar to Scottish are Bulgarian (4.8%, a difference of 0.13%), British (4.8%, a difference of 0.31%), Belgian (4.8%, a difference of 0.32%), Dutch (4.8%, a difference of 0.52%), and Zimbabwean (4.8%, a difference of 0.54%).
| Demographics | Rating | Rank | Male Unemployment |
| Carpatho Rusyns | 99.9 /100 | #22 | Exceptional 4.8% |
| Tongans | 99.9 /100 | #23 | Exceptional 4.8% |
| Immigrants | South Central Asia | 99.9 /100 | #24 | Exceptional 4.8% |
| Zimbabweans | 99.9 /100 | #25 | Exceptional 4.8% |
| Dutch | 99.9 /100 | #26 | Exceptional 4.8% |
| Belgians | 99.9 /100 | #27 | Exceptional 4.8% |
| Bulgarians | 99.8 /100 | #28 | Exceptional 4.8% |
| Scottish | 99.8 /100 | #29 | Exceptional 4.8% |
| British | 99.8 /100 | #30 | Exceptional 4.8% |
| Sudanese | 99.8 /100 | #31 | Exceptional 4.8% |
| Immigrants | Nepal | 99.8 /100 | #32 | Exceptional 4.8% |
| Latvians | 99.7 /100 | #33 | Exceptional 4.8% |
| Welsh | 99.7 /100 | #34 | Exceptional 4.8% |
| Paraguayans | 99.5 /100 | #35 | Exceptional 4.9% |
| Immigrants | Singapore | 99.4 /100 | #36 | Exceptional 4.9% |