Chinese vs Immigrants from Switzerland Male Unemployment
COMPARE
Chinese
Immigrants from Switzerland
Male Unemployment
Male Unemployment Comparison
Chinese
Immigrants from Switzerland
4.9%
MALE UNEMPLOYMENT
99.3/ 100
METRIC RATING
41st/ 347
METRIC RANK
5.2%
MALE UNEMPLOYMENT
79.2/ 100
METRIC RATING
141st/ 347
METRIC RANK
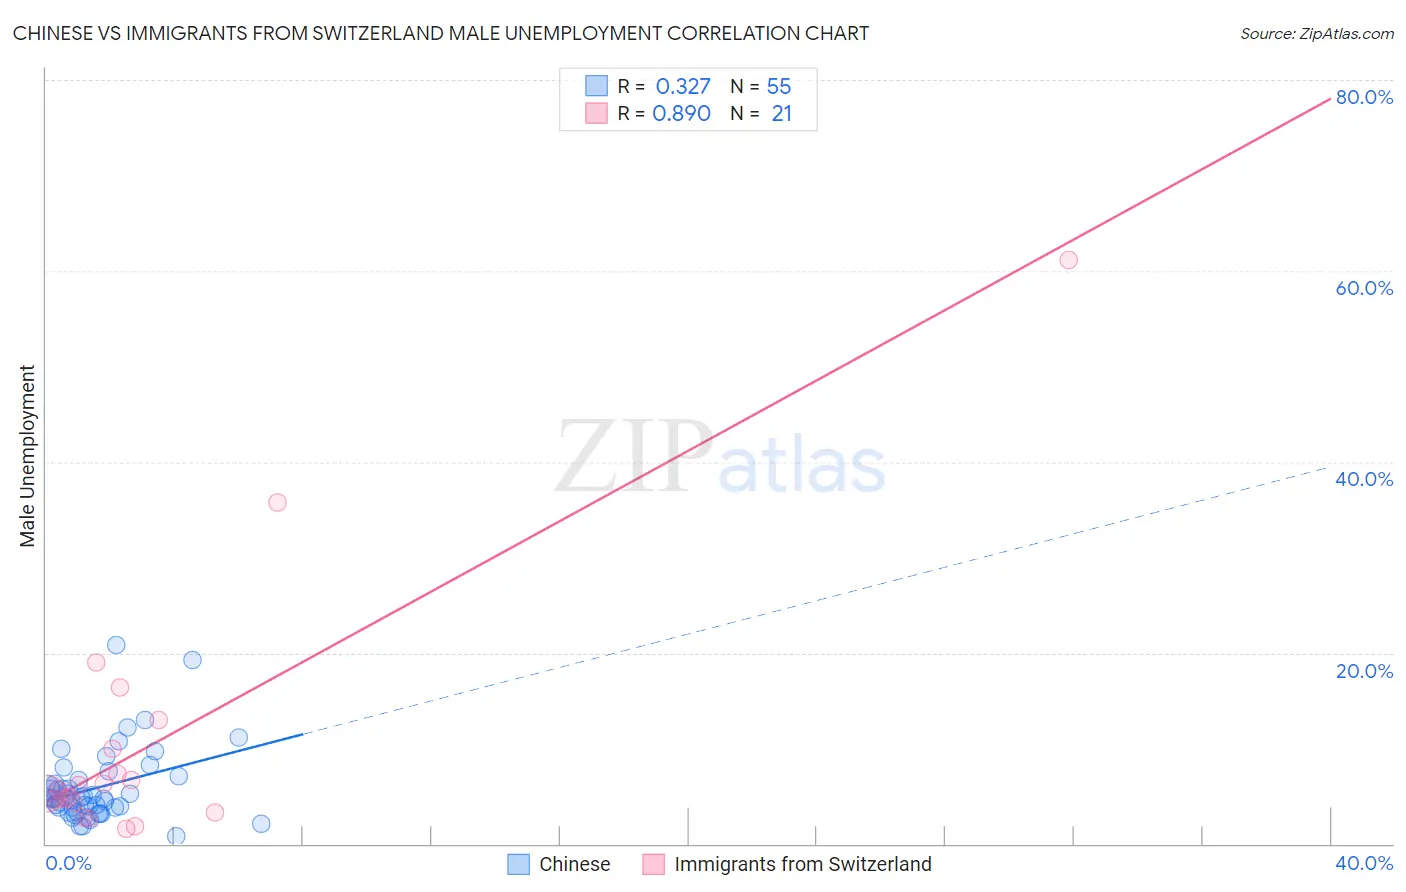
Chinese vs Immigrants from Switzerland Male Unemployment Correlation Chart
The statistical analysis conducted on geographies consisting of 64,756,701 people shows a mild positive correlation between the proportion of Chinese and unemployment rate among males in the United States with a correlation coefficient (R) of 0.327 and weighted average of 4.9%. Similarly, the statistical analysis conducted on geographies consisting of 147,847,273 people shows a very strong positive correlation between the proportion of Immigrants from Switzerland and unemployment rate among males in the United States with a correlation coefficient (R) of 0.890 and weighted average of 5.2%, a difference of 5.6%.
Male Unemployment Correlation Summary
| Measurement | Chinese | Immigrants from Switzerland |
| Minimum | 0.80% | 1.6% |
| Maximum | 20.8% | 61.1% |
| Range | 20.0% | 59.5% |
| Mean | 5.8% | 10.6% |
| Median | 4.8% | 5.6% |
| Interquartile 25% (IQ1) | 3.7% | 3.8% |
| Interquartile 75% (IQ3) | 6.7% | 11.5% |
| Interquartile Range (IQR) | 2.9% | 7.7% |
| Standard Deviation (Sample) | 3.8% | 13.9% |
| Standard Deviation (Population) | 3.8% | 13.6% |
Similar Demographics by Male Unemployment
Demographics Similar to Chinese by Male Unemployment
In terms of male unemployment, the demographic groups most similar to Chinese are Immigrants from Belgium (4.9%, a difference of 0.020%), Northern European (4.9%, a difference of 0.080%), Immigrants from Japan (4.9%, a difference of 0.13%), Burmese (4.9%, a difference of 0.17%), and Immigrants from Bosnia and Herzegovina (4.9%, a difference of 0.24%).
| Demographics | Rating | Rank | Male Unemployment |
| Welsh | 99.7 /100 | #34 | Exceptional 4.8% |
| Paraguayans | 99.5 /100 | #35 | Exceptional 4.9% |
| Immigrants | Singapore | 99.4 /100 | #36 | Exceptional 4.9% |
| Scotch-Irish | 99.4 /100 | #37 | Exceptional 4.9% |
| Immigrants | Bosnia and Herzegovina | 99.4 /100 | #38 | Exceptional 4.9% |
| Burmese | 99.3 /100 | #39 | Exceptional 4.9% |
| Northern Europeans | 99.3 /100 | #40 | Exceptional 4.9% |
| Chinese | 99.3 /100 | #41 | Exceptional 4.9% |
| Immigrants | Belgium | 99.2 /100 | #42 | Exceptional 4.9% |
| Immigrants | Japan | 99.2 /100 | #43 | Exceptional 4.9% |
| Immigrants | Korea | 99.1 /100 | #44 | Exceptional 4.9% |
| Immigrants | Zimbabwe | 99.0 /100 | #45 | Exceptional 4.9% |
| Bhutanese | 98.9 /100 | #46 | Exceptional 4.9% |
| Austrians | 98.9 /100 | #47 | Exceptional 4.9% |
| Immigrants | Scotland | 98.9 /100 | #48 | Exceptional 4.9% |
Demographics Similar to Immigrants from Switzerland by Male Unemployment
In terms of male unemployment, the demographic groups most similar to Immigrants from Switzerland are Brazilian (5.2%, a difference of 0.010%), Kenyan (5.2%, a difference of 0.020%), Immigrants from Croatia (5.2%, a difference of 0.040%), Immigrants from Eastern Africa (5.2%, a difference of 0.050%), and Lebanese (5.2%, a difference of 0.060%).
| Demographics | Rating | Rank | Male Unemployment |
| Pakistanis | 80.5 /100 | #134 | Excellent 5.2% |
| Immigrants | Saudi Arabia | 80.1 /100 | #135 | Excellent 5.2% |
| Lebanese | 79.9 /100 | #136 | Good 5.2% |
| Immigrants | Eastern Africa | 79.8 /100 | #137 | Good 5.2% |
| Immigrants | Croatia | 79.7 /100 | #138 | Good 5.2% |
| Kenyans | 79.4 /100 | #139 | Good 5.2% |
| Brazilians | 79.3 /100 | #140 | Good 5.2% |
| Immigrants | Switzerland | 79.2 /100 | #141 | Good 5.2% |
| Fijians | 78.3 /100 | #142 | Good 5.2% |
| Syrians | 78.0 /100 | #143 | Good 5.2% |
| Sri Lankans | 77.9 /100 | #144 | Good 5.2% |
| Macedonians | 77.7 /100 | #145 | Good 5.2% |
| Immigrants | Kenya | 77.6 /100 | #146 | Good 5.2% |
| Immigrants | Burma/Myanmar | 77.5 /100 | #147 | Good 5.2% |
| Immigrants | Italy | 76.3 /100 | #148 | Good 5.2% |